Logs and Monitoring
ACCELERO has a complete logging and monitoring system for real-time tracking and auditing of all system operations.
Access Log
Navigation path: Logs > Access log
One of the most important functions of an access control system is the real-time monitoring of the events that happen on the controllers.
What Events Are
All events that happen on a controller are logged automatically:
- People passing through
- Denied accesses
- Alarms
- Manual opening commands
- System events
Features
Available resources:
| Resource | Description |
|---|---|
| Real-time monitoring | Events appear instantly as they happen |
| Navigation to registrations | Click on the person's name to go straight to the registration |
| Advanced filters | Filter by period, controller, event type, person, etc. |
| Colors by category | Events visually categorized by colors |
You can customize the colors used in the access log through the menu Advanced > Customization > Access log.
Event Categories
Events are categorized by color to make visualization easier:
- Green: Access authorized/completed
- Red: Access denied
- Yellow: Alarms and warnings
- Blue: System events
- Gray: Other events
Colors can be customized according to operational needs.
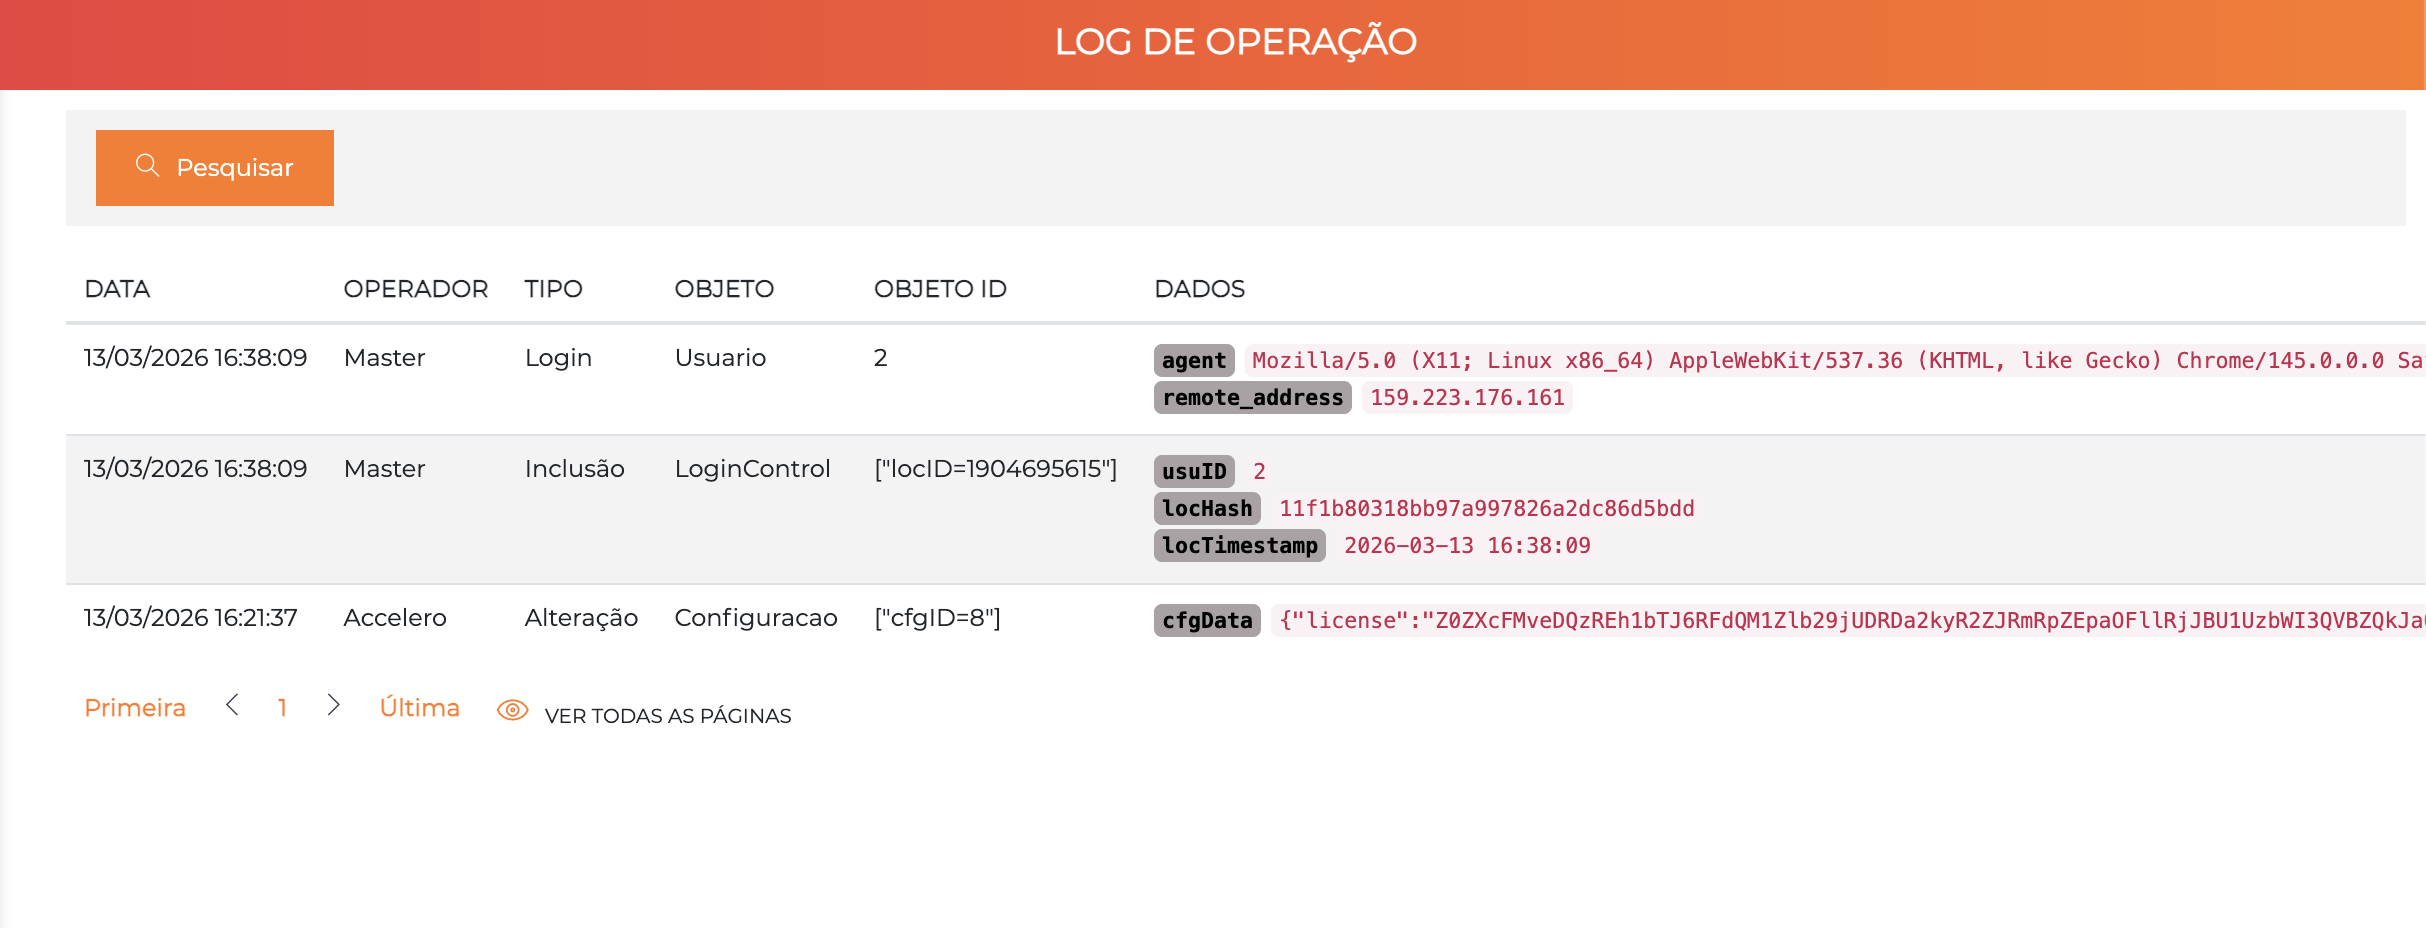
Operation Log
Navigation path: Logs > Operation log
The operation log is ACCELERO's auditing tool.
What Is Recorded
All destructive actions performed by operators are stored:
| Action Type | Examples |
|---|---|
| Creation | New registration of a person, category, area, etc. |
| Change | Modification of existing data |
| Deletion | Removal of records |
Stored Information
For each operation, the system records:
- Who performed the action (operator)
- When the action was performed (date/time)
- What was changed (specific data, when applicable)
- Type of operation (insertion, change, deletion)
- Detailed description of the operation performed, including specific changed data
All operation logs have an identifier with sequential numbering, which ensures the consistency of the information and prevents tampering.
As described in Maintenance - Log Deletion, when operation logs are deleted, a special log is created reporting this action, and this log is never deleted.
System Log
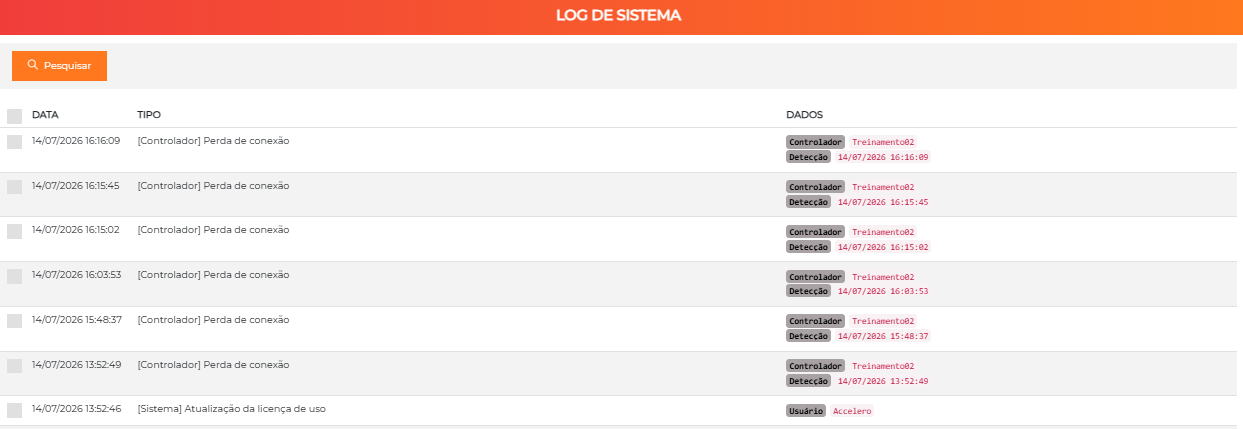
Navigation path: Logs > System log
Some events that occur in the system generate specific technical logs.
What System Logs Are
These are special events that, in general, should be monitored by a technical responsible:
| Event Type | Description |
|---|---|
| Communication problems | Failures in communication with controllers |
| Integration errors | Problems with integrated subsystems |
| Technical events | Situations in which it is not possible to show messages to the operator |
When to Use
The system log is ideal for:
- Technical troubleshooting: Diagnosis of problems
- Preventive monitoring: Identify problems before they affect operation
- Integrations: Track communication with external systems
This screen is aimed at technicians and integrators, not common operators.
Block Monitoring
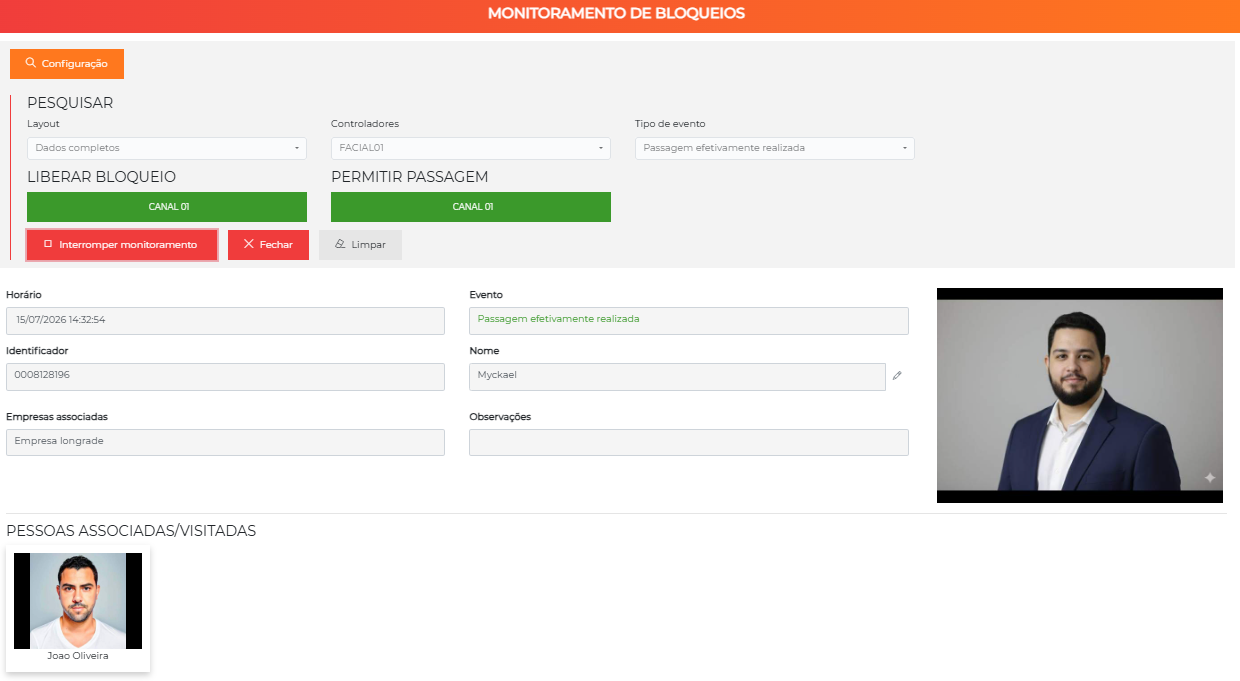
Navigation path: Logs > Block monitoring
Block monitoring is a function similar to the Event Log, but with a more complete display of data (not in list format).
Differences from the Event Log
| Characteristic | Access Log | Block Monitoring |
|---|---|---|
| Format | Compact list | Rich display with photos |
| Focus | Multiple devices | Single or few devices |
| Information | Basic data | Photos, complete data, associations |
| Commands | No | Yes (quick opening) |
Displayed Information
When an event occurs, the monitoring shows:
- Photo of the person who is accessing
- Complete data of the person
- Associated people (family module)
- Visited person (when it is a visitor)
- Event status (authorized, pending, etc.)
To view associated people, the family module must be enabled.
Quick Commands
When a single device is being monitored, you can:
- Send an opening command for the block
- Release passage manually
- Authorize event (change the visit status to "Authorized")
This screen is ideal for use in:
- Vehicle lanes
- 24-hour monitored blocks
- Gatehouses with a doorkeeper
Available Layouts
The screen allows the use of several layouts for better suitability:
- Layout for computers/tablets
- Layout for smartphones
- Layout for distant monitors (large text)
- Simplified layout
Check-in Monitor
Navigation path: Logs > Check-in monitor
The check-in monitor is a kind of electronic panel that allows real-time visualization of visit events awaiting authorization.
How It Works
The monitor displays:
| Status | Description | Color |
|---|---|---|
| Waiting (Check-in) | Visits that need authorization | Yellow |
| Authorized | Visits already authorized awaiting entry | Green |
Characteristics
Automatic update:
- When a visit changes status, it appears in a different color for a few seconds to draw attention
- After the visitor's first passage, the visit disappears automatically
- Everything is automated - with no need for manual intervention
Full-Screen Mode
The monitor can be used in full-screen mode, ideal for:
- Electronic panels at reception desks
- TVs in waiting rooms
- Self-service kiosks
How to activate: Click the "resize" icon next to the screen title.
Data Privacy
To protect the personal data of visitors and visited people, all visits in the check-in monitor are identified by a locator (numeric code), which can be printed on the access QR codes.
If you prefer, the setting Show visitor name on the check-in monitor? (in Advanced > System) replaces the locator with the visitor's name on the panel.
Typical Use
Common scenario:
- Visitor schedules a visit through the app
- Arrives at reception and looks at the panel
- Panel shows the locator in "Waiting" status
- Visited person authorizes remotely
- Panel changes to "Authorized" highlighted
- Visitor can proceed to entry
See Events - Check-in for more details.
Include a screenshot of the check-in monitor showing waiting and authorized visits.
Arrivals Monitor
Navigation path: Logs > Arrivals monitor
The arrivals monitor is a mix between the Event Log and Block Monitoring, ideal for queue management. The screen updates in real time as people access.
The Arrivals monitor is an additional module (monitorcheg). See Licensing.
Display
The screen shows two lists simultaneously:
-
Event list (Event Log mode)
- People who accessed certain blocks in real time
-
Associated people list (Block Monitoring mode)
- Automatically identified related people
Use Cases
| Scenario | How It Works |
|---|---|
| Schools | Parents arrive to pick up their children. The system shows which children are in the internal area and should be called |
| Logistics yards | Trucks arriving. The system shows the associated cargo/driver for quick routing |
| Clinics | Patient arrives. The system shows the scheduled doctor/procedure |
Filter Configuration
Available filters:
| Filter | Function |
|---|---|
| Controllers | Observe only events from specific controllers |
| Event type | Ignore non-operational events (e.g., door-open alarm) |
| Show associated | Defines which type of association to show (e.g., "Children") |
| ...that are in the areas | Shows only associated people who are in specific areas |
| Display | Choose between showing all events or only those with related people — in the latter, only events of those who have linked associates appear (e.g., only parents who have children) |
| Photos | Show or hide people's photos on the screen |
| Fetch latest events | Retrieves previous events (in minutes/hours) when starting the monitoring — or fetch nothing |
Practical Example: School
Configuration:
- Controller: MAIN GATE
- Event type: Access completed
- Show associated: CHILDREN
- That are in the areas: INTERNAL AREA
- Display: Only with related people

How it works:
1. Parent presents identifier at the gate
2. Monitor shows the parent's photo + list of children who are at the school
3. Each arrival enters the screen in real time, forming a queue
   in the order in which the parents arrive
4. The inspector calls the students following this exit order
5. Fast process, without errors and without calling those who have no children at the school
With the Display: Only with related people filter, the monitor ignores those who have no linked children and shows only the relevant parents. Since the list updates in real time as identifiers are presented at the gate, it works as an exit queue for the students in the order of their guardians' arrival.
Additional Resources
Automatic photo:
- Option to show people's photos automatically or on demand (click)
- Optimizes screen space
Quick actions:
- Configure shortcuts for common tasks — currently, Add category to the person (for a set time) directly from the arrival screen, with one click
- Speeds up operation in high-demand scenarios
See Global Settings — Arrivals Monitor - Quick Actions for configuration.
Include a screenshot of the arrivals monitor showing an event and associated people.
Operational Statistics
Navigation path: Advanced > System > System - Operational statistics
ACCELERO has a tool that allows you to track operational statistics in the form of on-screen reports.
Available Statistics
Several statistics are available, each on a tab:
1. Operational Usage
Allows you to see the most common types of operation performed by each operator.
Information:
- Which operators perform the most insertions
- Which operators make the most changes
- Operators most active in settings
- System usage patterns
Use: Identify operators who need training or validate operational processes.
2. Access Event Types
Quick statistic of which access events are being generated most frequently:
- Access completed
- Access denied
- Passage timeout
- Anti-double entry
- Etc.
This is an important tool to check the health of the system. Many block events, for example, can mean configuration problems.
Diagnosis example:
If 30% of the events are "Access denied":
→ May indicate a permission configuration problem
→ Or identifiers not associated correctly
3. Access - Usage by Area
Quick statistic that lets you see which areas are most accessed in a given period:
- Without distinction of people categories
- Useful for capacity planning
- Identifies underused or overloaded areas
4. Visitors by Company
Allows the visualization of the number of visitors per company in a given period.
Uses:
- Identify companies that receive the most visits
- Plan reception resources
- Visitor flow analysis
Include a screenshot of the operational statistics showing usage charts.
Best Practices
Access Log
-
Configure meaningful colors: Use intuitive colors for each event type
-
Use saved filters: Create custom filters for common situations
-
Monitor in real time: Keep the log open during 24-hour operation
-
Train operators: Ensure they know how to interpret events
Operation Log
-
Review periodically: Perform a regular audit of the actions
-
Identify suspicious patterns: Many changes can indicate problems
-
Back up before deletion: Always generate a backup before deleting logs
-
Document deletions: Keep a record of when and why logs were deleted
Block Monitoring
-
Use an appropriate layout: Choose the layout according to the device and distance
-
Monitor few blocks: Focus on 1-3 blocks for better visualization
-
Configure quick actions: Speeds up operation in common situations
Check-in Monitor
-
Use full screen: Maximize visibility for visitors
-
Position the monitor well: Place it in a visible spot at reception
-
Configure clear locators: Use an easy-to-read format (e.g., large numbers)
Arrivals Monitor
-
Configure correct filters: Essential to show relevant information
-
Test before use: Validate the configuration during low-traffic hours
-
Train the team: Ensure they understand how to use quick actions
Operational Statistics
-
Review weekly: Track usage trends
-
Investigate anomalies: A high rate of denials indicates a problem
-
Use for training: Identify operators who need training
-
Plan resources: Use area data to allocate resources
Next Steps
- Maintenance - Configure automatic log deletion
- Events - Understand events and visitor check-in
- Reports - Generate detailed access reports
- Incident Panel - Manage critical incidents