Daily Access Report
The Daily Access Report adds to ACCELERO a report that totals the number of accesses completed per day, grouped by area. It is useful for tracking the flow of people at each location over time — for example, comparing daily activity between areas or identifying peaks and drops in access over a period.
This feature is provided as a plugin (dailyaccess) and must be installed and enabled by the IONGRADE technical team. Consult support to check compatibility with your version of ACCELERO.
Current plugin version: 0.0.3 — compatible with ACCELERO 2.16.5, 2.16.6, 2.16.7, and 2.16.8.
What the plugin does
| Feature | What happens in ACCELERO |
|---|---|
| New report | Adds the Daily access report item to the central Reports screen |
| Totaling by day and area | Counts the number of accesses actually completed, grouping by date and by area |
| Filters | Lets you narrow the report by period (From / To) and by Areas |
| Asynchronous generation | The report is processed in the background and becomes available in the history when finished |
| Templates and history | Lets you save the filter configuration as a template and consult previously generated reports |
Offers a consolidated view of the access volume per day and per area, without the need to cross-reference logs manually.
The report considers only access completed events (passage actually carried out). For each date-and-area combination, the number of distinct access objects (people who accessed) is counted — that is, multiple passages by the same person, in the same area and on the same day, do not inflate the total.
Access to the report
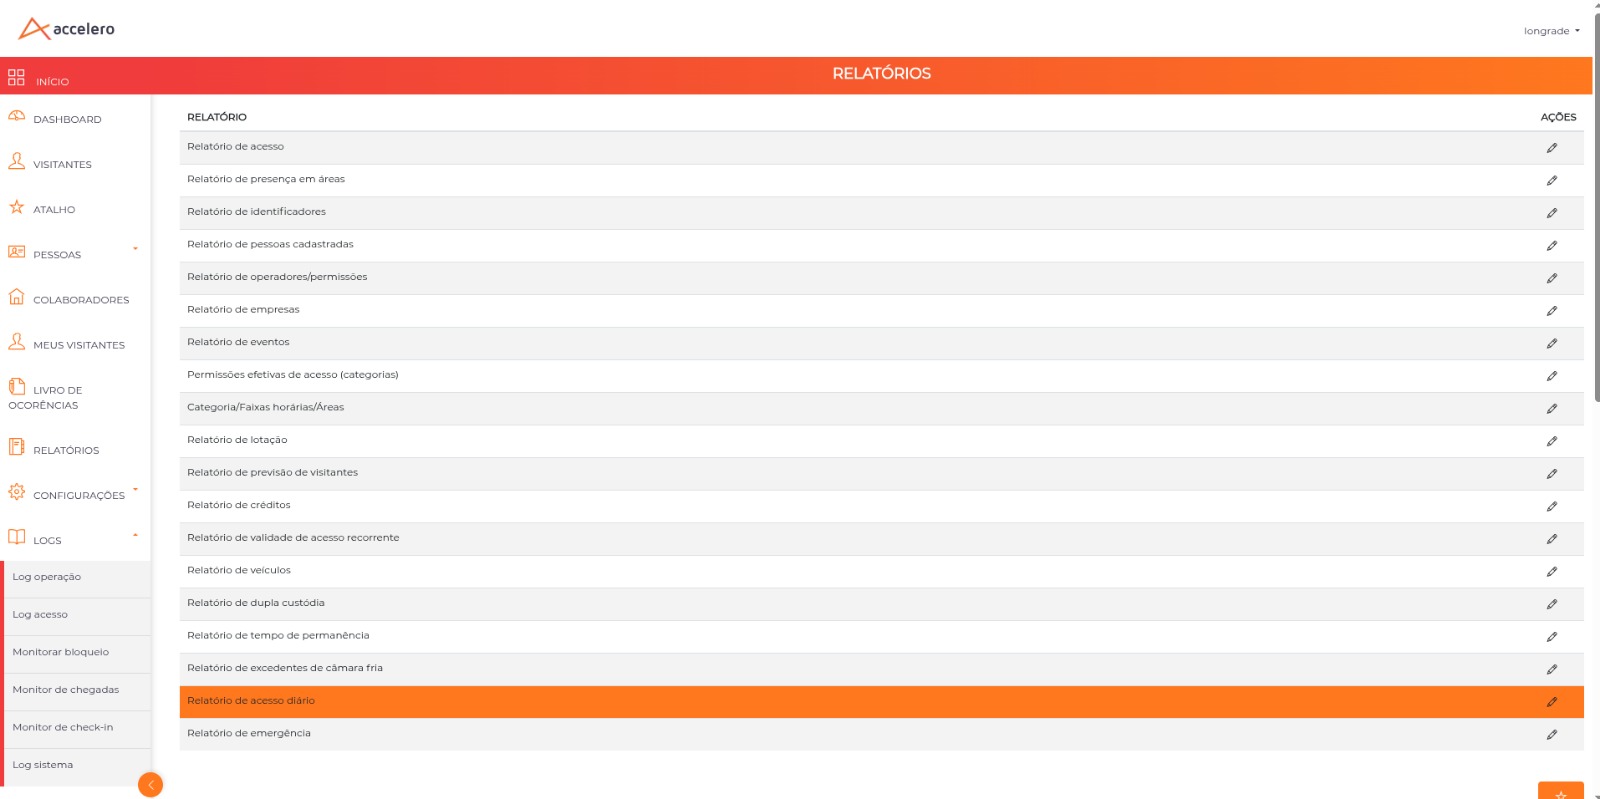
Navigation path: Reports > Daily access report
The plugin inserts a new row on ACCELERO's central Reports screen. Click the edit button of the Daily access report row to open the generation screen.
The plugin creates the Daily Access Report permission (ReportDailyAccess), with the access, listing, editing, creation, and deletion actions. Ensure that the operator's profile has this permission to view and generate the report.
Generation screen
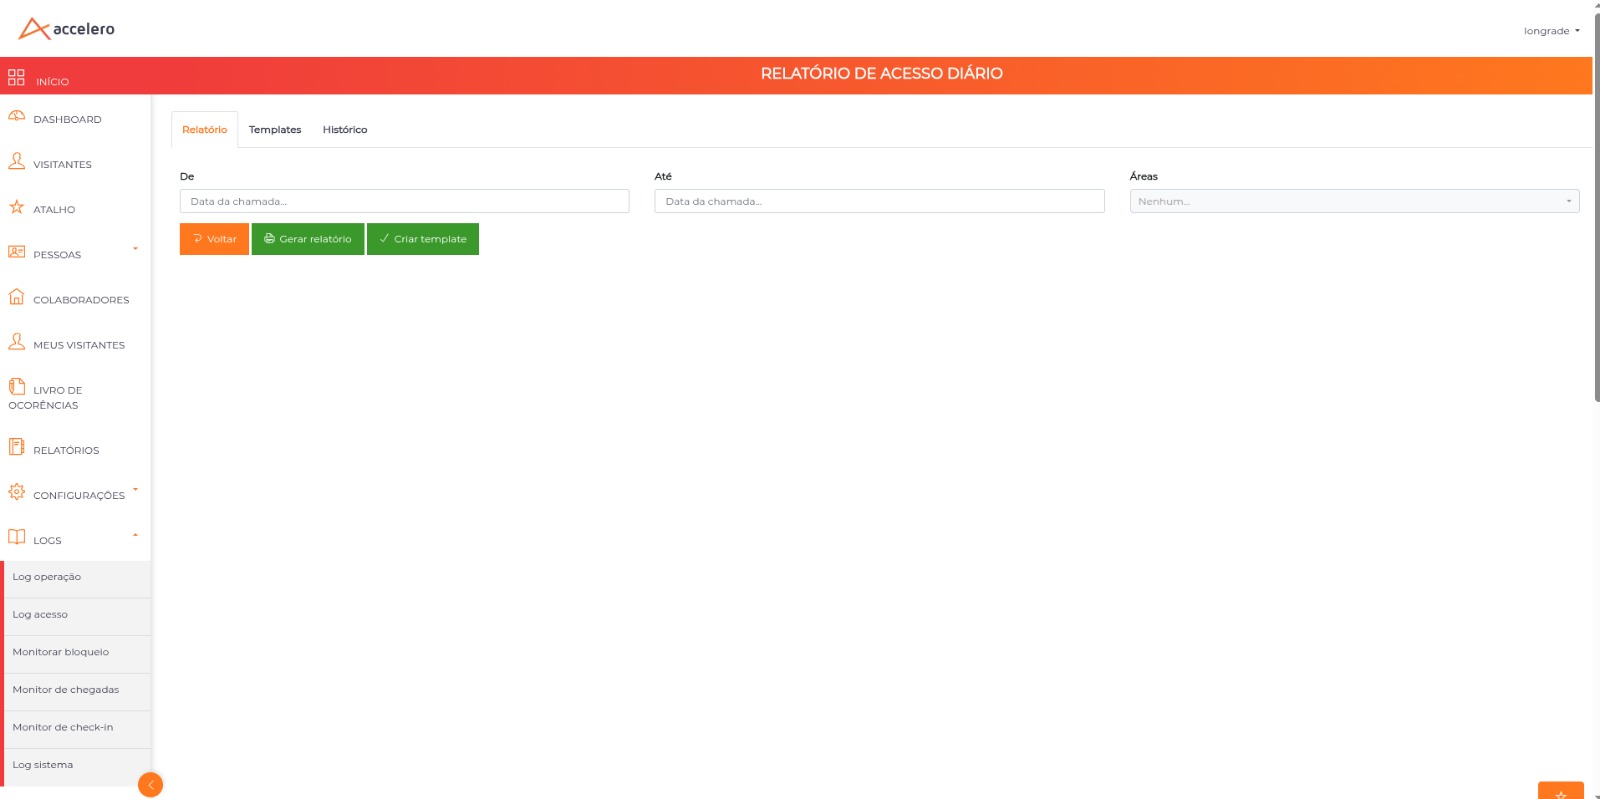
The report screen has three tabs:
| Tab | Content |
|---|---|
| Report | Form with the filters and the generation buttons |
| Templates | Saved report templates (reusable filter configurations) |
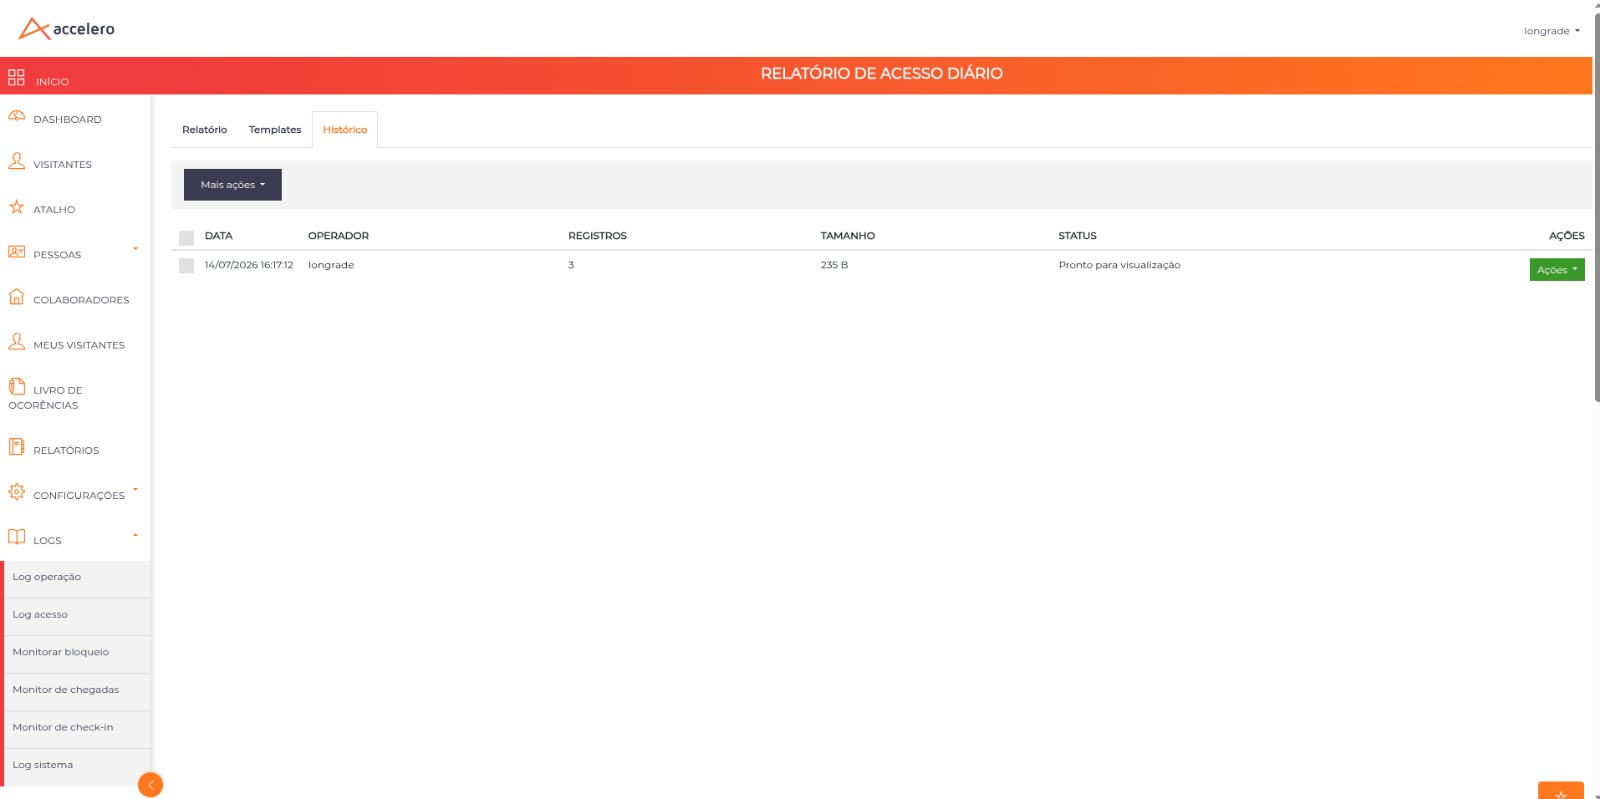
| History | Reports already generated, available for consultation and download |
Filters
| Field | Description |
|---|---|
| From | Start date and time of the considered period |
| To | End date and time of the considered period |
| Areas | (Multiple) selection of the areas to include. If no area is selected, all are considered |
The From and To fields are mandatory.
Buttons
| Button | Function |
|---|---|
| Generate report | Starts the report generation with the entered filters. Processing occurs in the background |
| Create template | Saves the current filter configuration as a reusable template (Templates tab) |
| Back | Returns to the previous screen |
If you frequently generate the same view (e.g., always the same areas), save a template to reapply the filters without reconfiguring them each time.
Report content
After generation, the report becomes available on the History tab. Each row corresponds to a combination of date and area, with the columns:
| Column | Content |
|---|---|
| Date | Day to which the accesses refer |
| Number of accesses | Number of distinct people who accessed that area, on that day |
| Area | Area where the accesses occurred |
The results are sorted by date.
On the History tab, each generation appears as a row with Date, Operator, Records, Size and Status — the Actions menu gives access to the result once the status is Ready for viewing.
The opened report result, showing the Date, Number of accesses, and Area columns.
The filter view used in each generation (period and areas) is recorded alongside the report, in a readable way, for later verification of what was queried.
Use cases
Track daily activity by area
- Go to
Reports > Daily access report. - On the Report tab, enter the period in From and To.
- In Areas, select the areas of interest (or leave blank for all).
- Click Generate report.
- Track the result on the History tab as soon as processing finishes.
Save a recurring view
- Configure the desired filters (period and areas).
- Click Create template.
- In the next generations, open the Templates tab and reapply the saved configuration.
Best practices
- Objective periods: Narrow the period according to the desired analysis. Very long periods generate extensive reports and slower processing.
- Select relevant areas: When the interest is in specific locations, filter by area to reduce the volume of data and make reading easier.
- Use templates: For recurring analyses, save the filters as a template and avoid reconfiguring at each generation.
Troubleshooting
The report does not appear on the Reports screen
Possible causes:
- Plugin is not enabled
- Operator without the Daily Access Report permission
Solution:
- Confirm with IONGRADE support whether the
dailyaccessplugin is installed and enabled. - Check that the operator's profile has the Daily Access Report permission.
The report stays processing and does not finish
Possible causes:
- Very wide period, generating a large volume of data
- Asynchronous processing in queue
Solution:
- Wait for the background processing to finish and refresh the History tab.
- If the problem persists, reduce the queried period and generate again.
- If the failure persists, contact IONGRADE support.
Integration with other modules
Areas
The report groups the accesses by Areas. The correct configuration of the areas is what determines the displayed grouping.
Logs and Monitoring
The report is built from the access completed events recorded in the logs. See Logs and Monitoring to understand which events are captured by ACCELERO.
Reports
The Daily access report integrates with the central Reports screen, sharing the tab structure (Report, Templates, History) and the asynchronous generation flow of the other reports.
Next Steps
- Reports — Understand ACCELERO's central reports screen
- Areas — Configure the areas that will be grouped in the report
- Logs and Monitoring — See which access events are recorded
- Operational Statistics — Another report for access analysis
- Plugins — Learn more about ACCELERO's plugin system