Command Center
The Command Center is the main monitoring screen of the ION Guard platform. It displays an interactive map with all of the organization's sites and their real-time alerts.
Navigation path: Side menu → Command Center (top-level item, with a monitor icon)
Map view
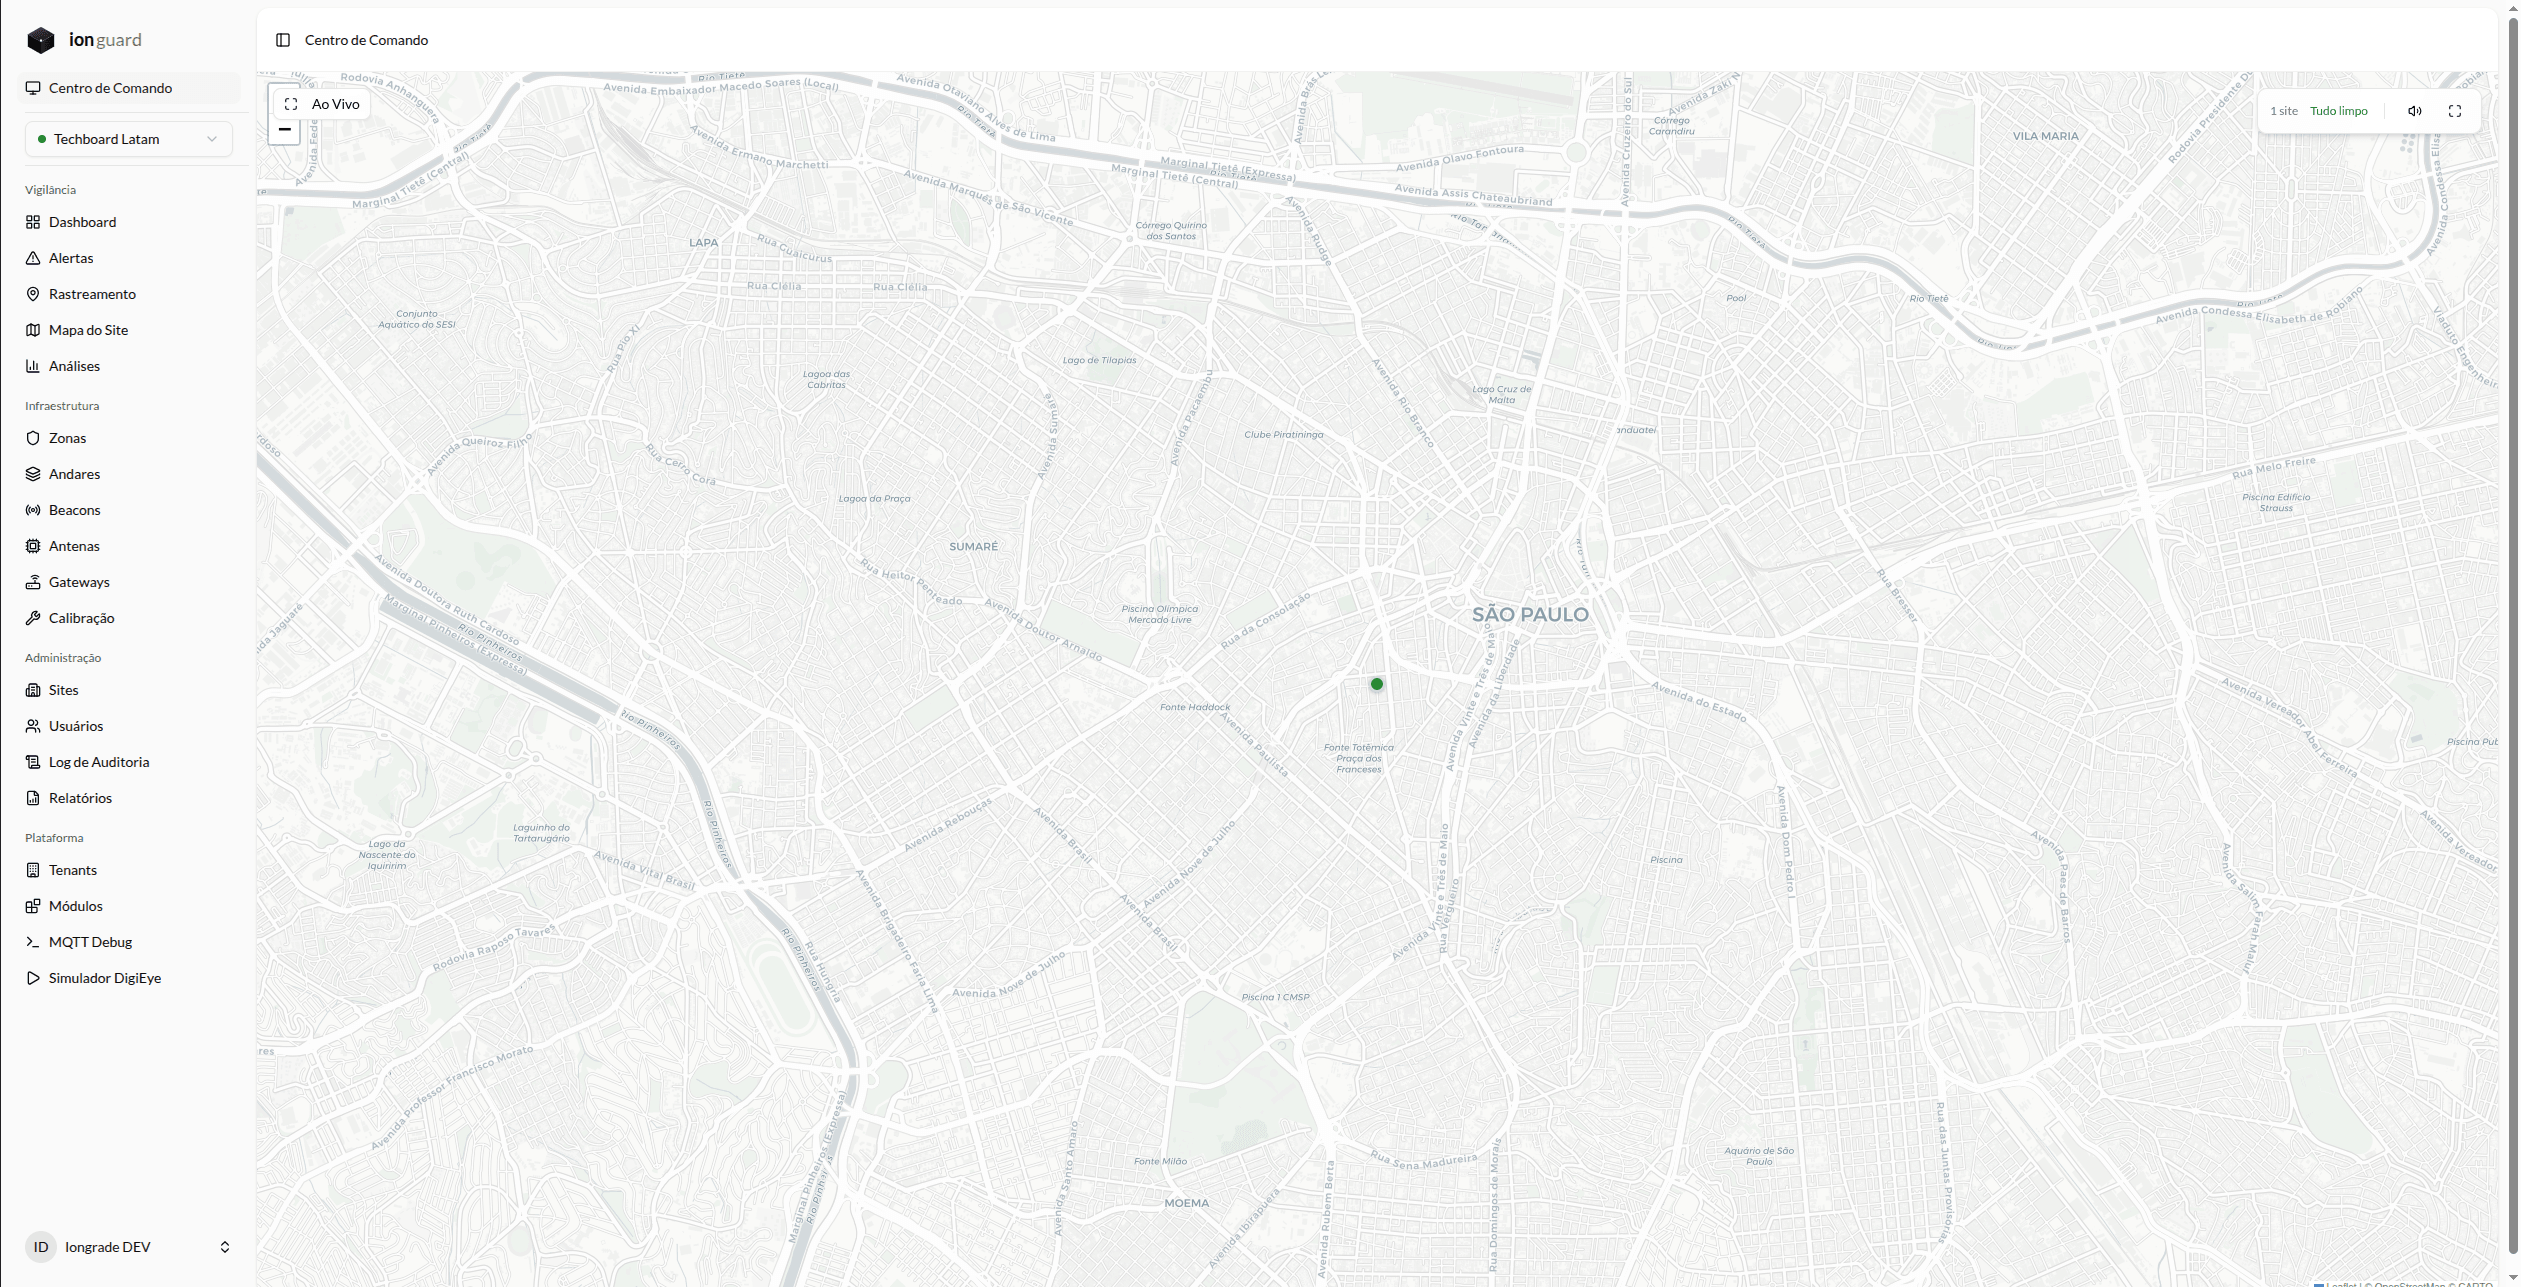
Interactive map
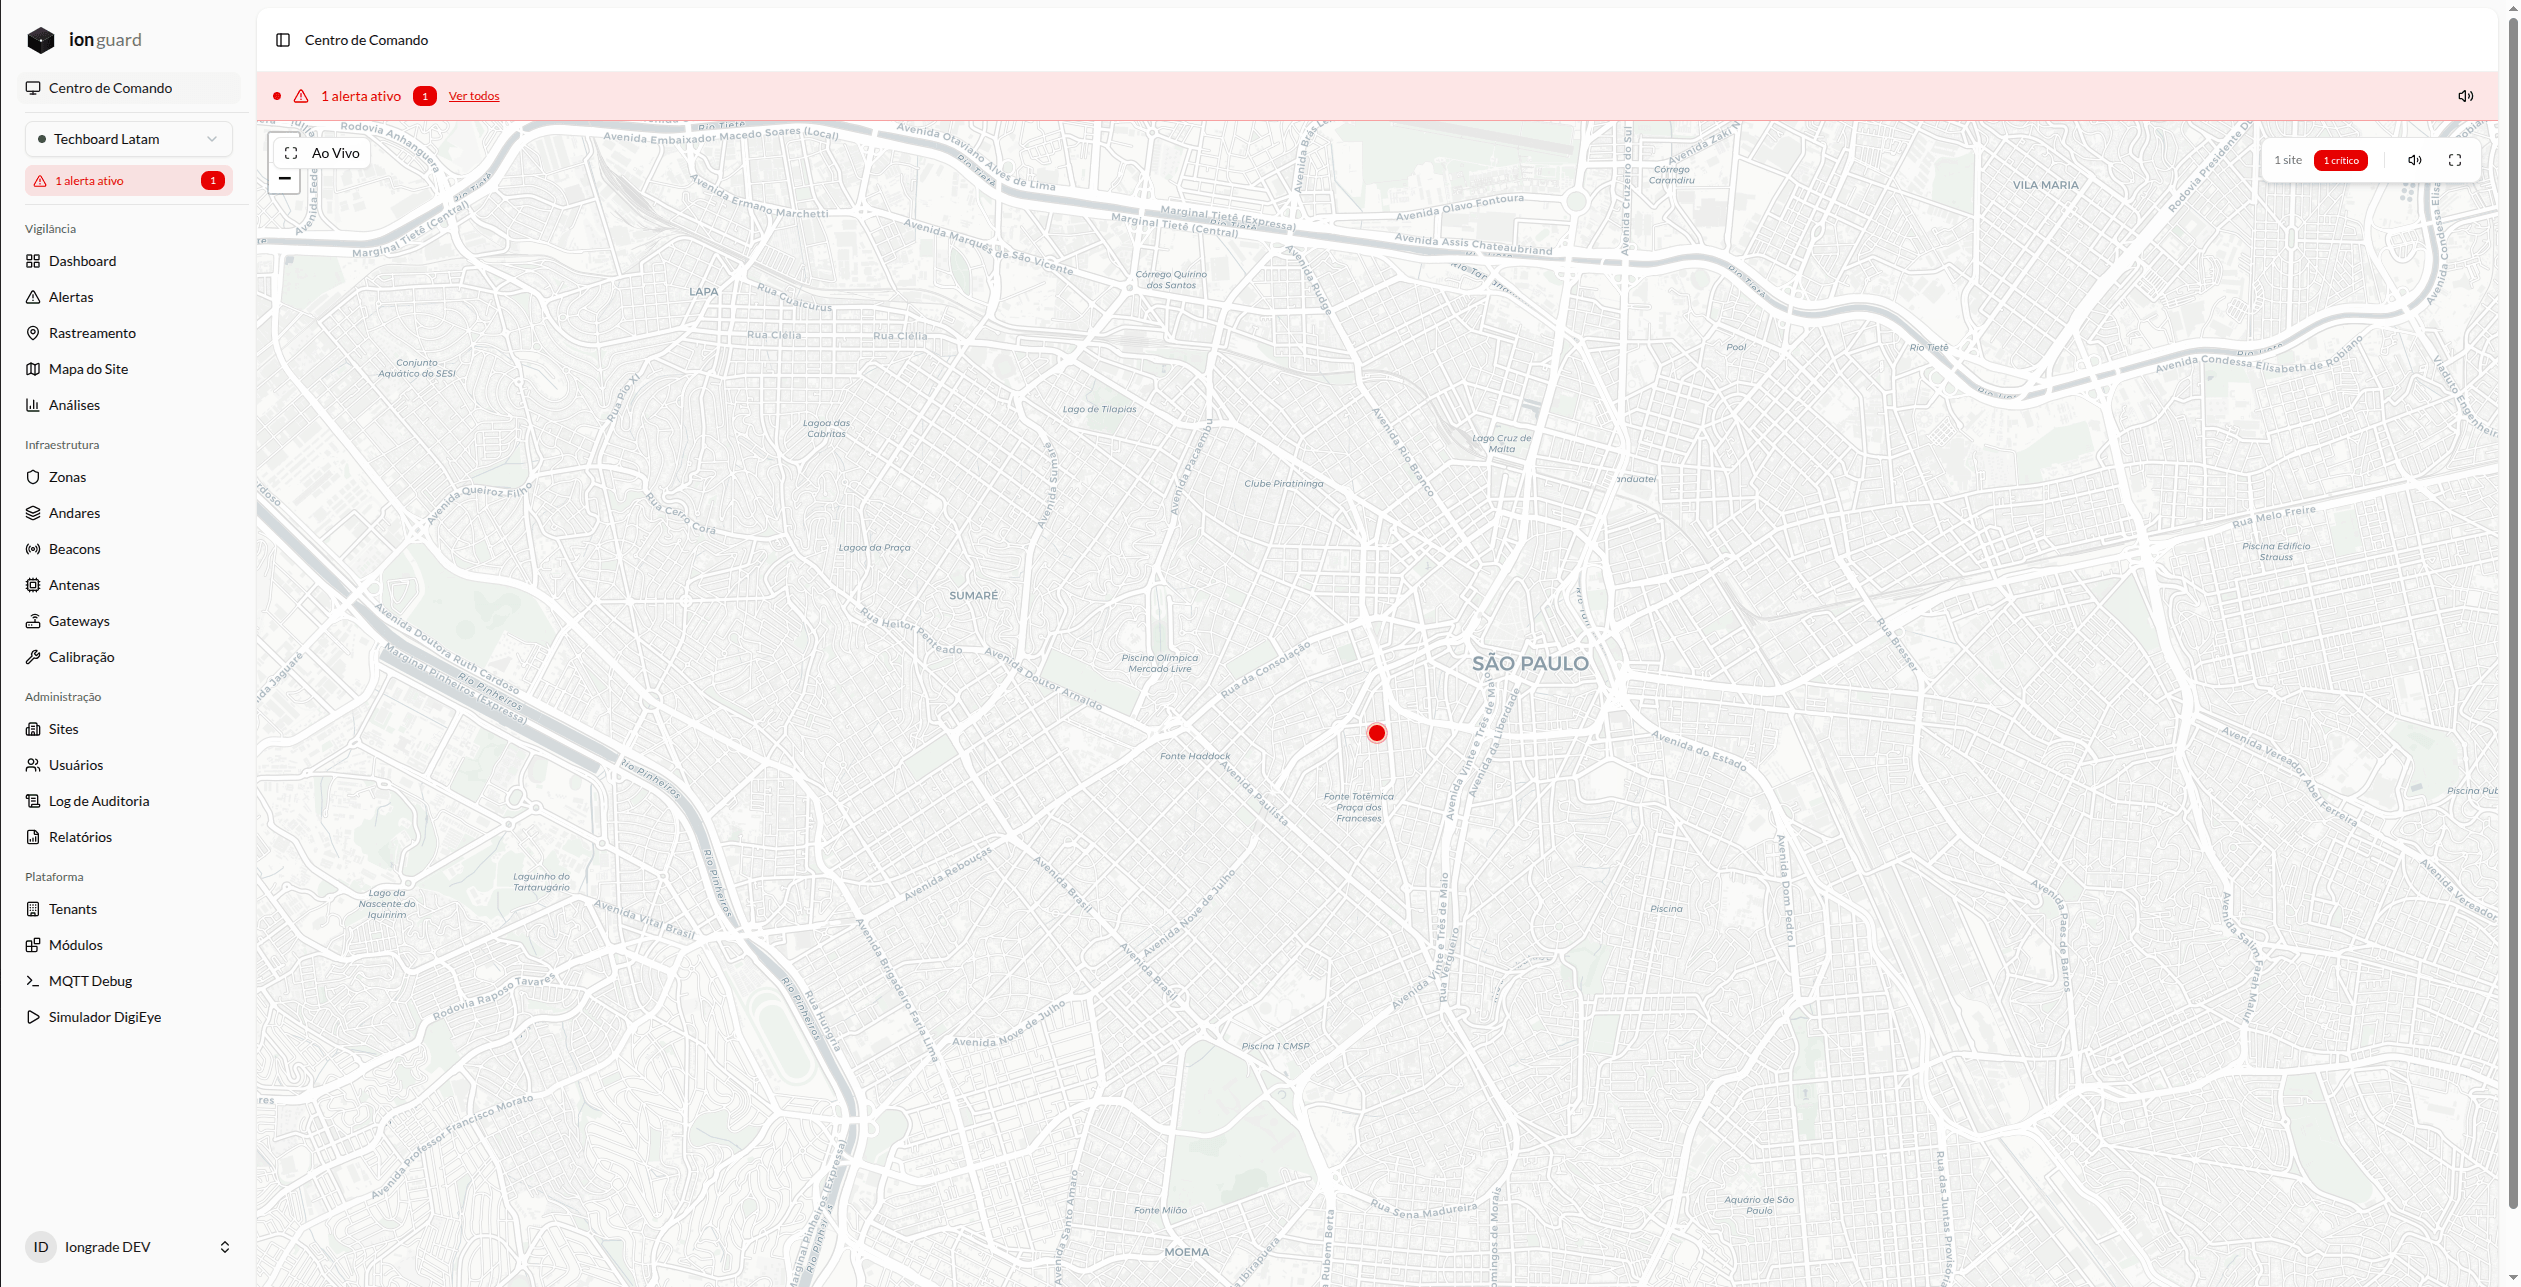
All sites with configured geographic coordinates are displayed as markers on the map. Markers are colored according to alert severity:
- Red — Site with critical severity alerts
- Orange — Site with high severity alerts
- Amber — Site with warning severity alerts
- Blue — Site with info severity alerts
- Green — Site with no active alerts
The marker always reflects the worst severity among the site's active alerts.
Alert summary
In the upper-right corner, a panel shows:
- Count of monitored sites
- Alerts by severity — when there are alerts, badges with the count by severity (critical, high, warning); when there are none, an "all clear" indicator
- Mute button — Silences/enables sound notifications
- Fullscreen button — Expands the map
Unmapped sites
In the lower-left corner, an indicator shows how many sites do not have coordinates configured. These sites do not appear on the map but their alerts are counted in the summary.
Site interaction
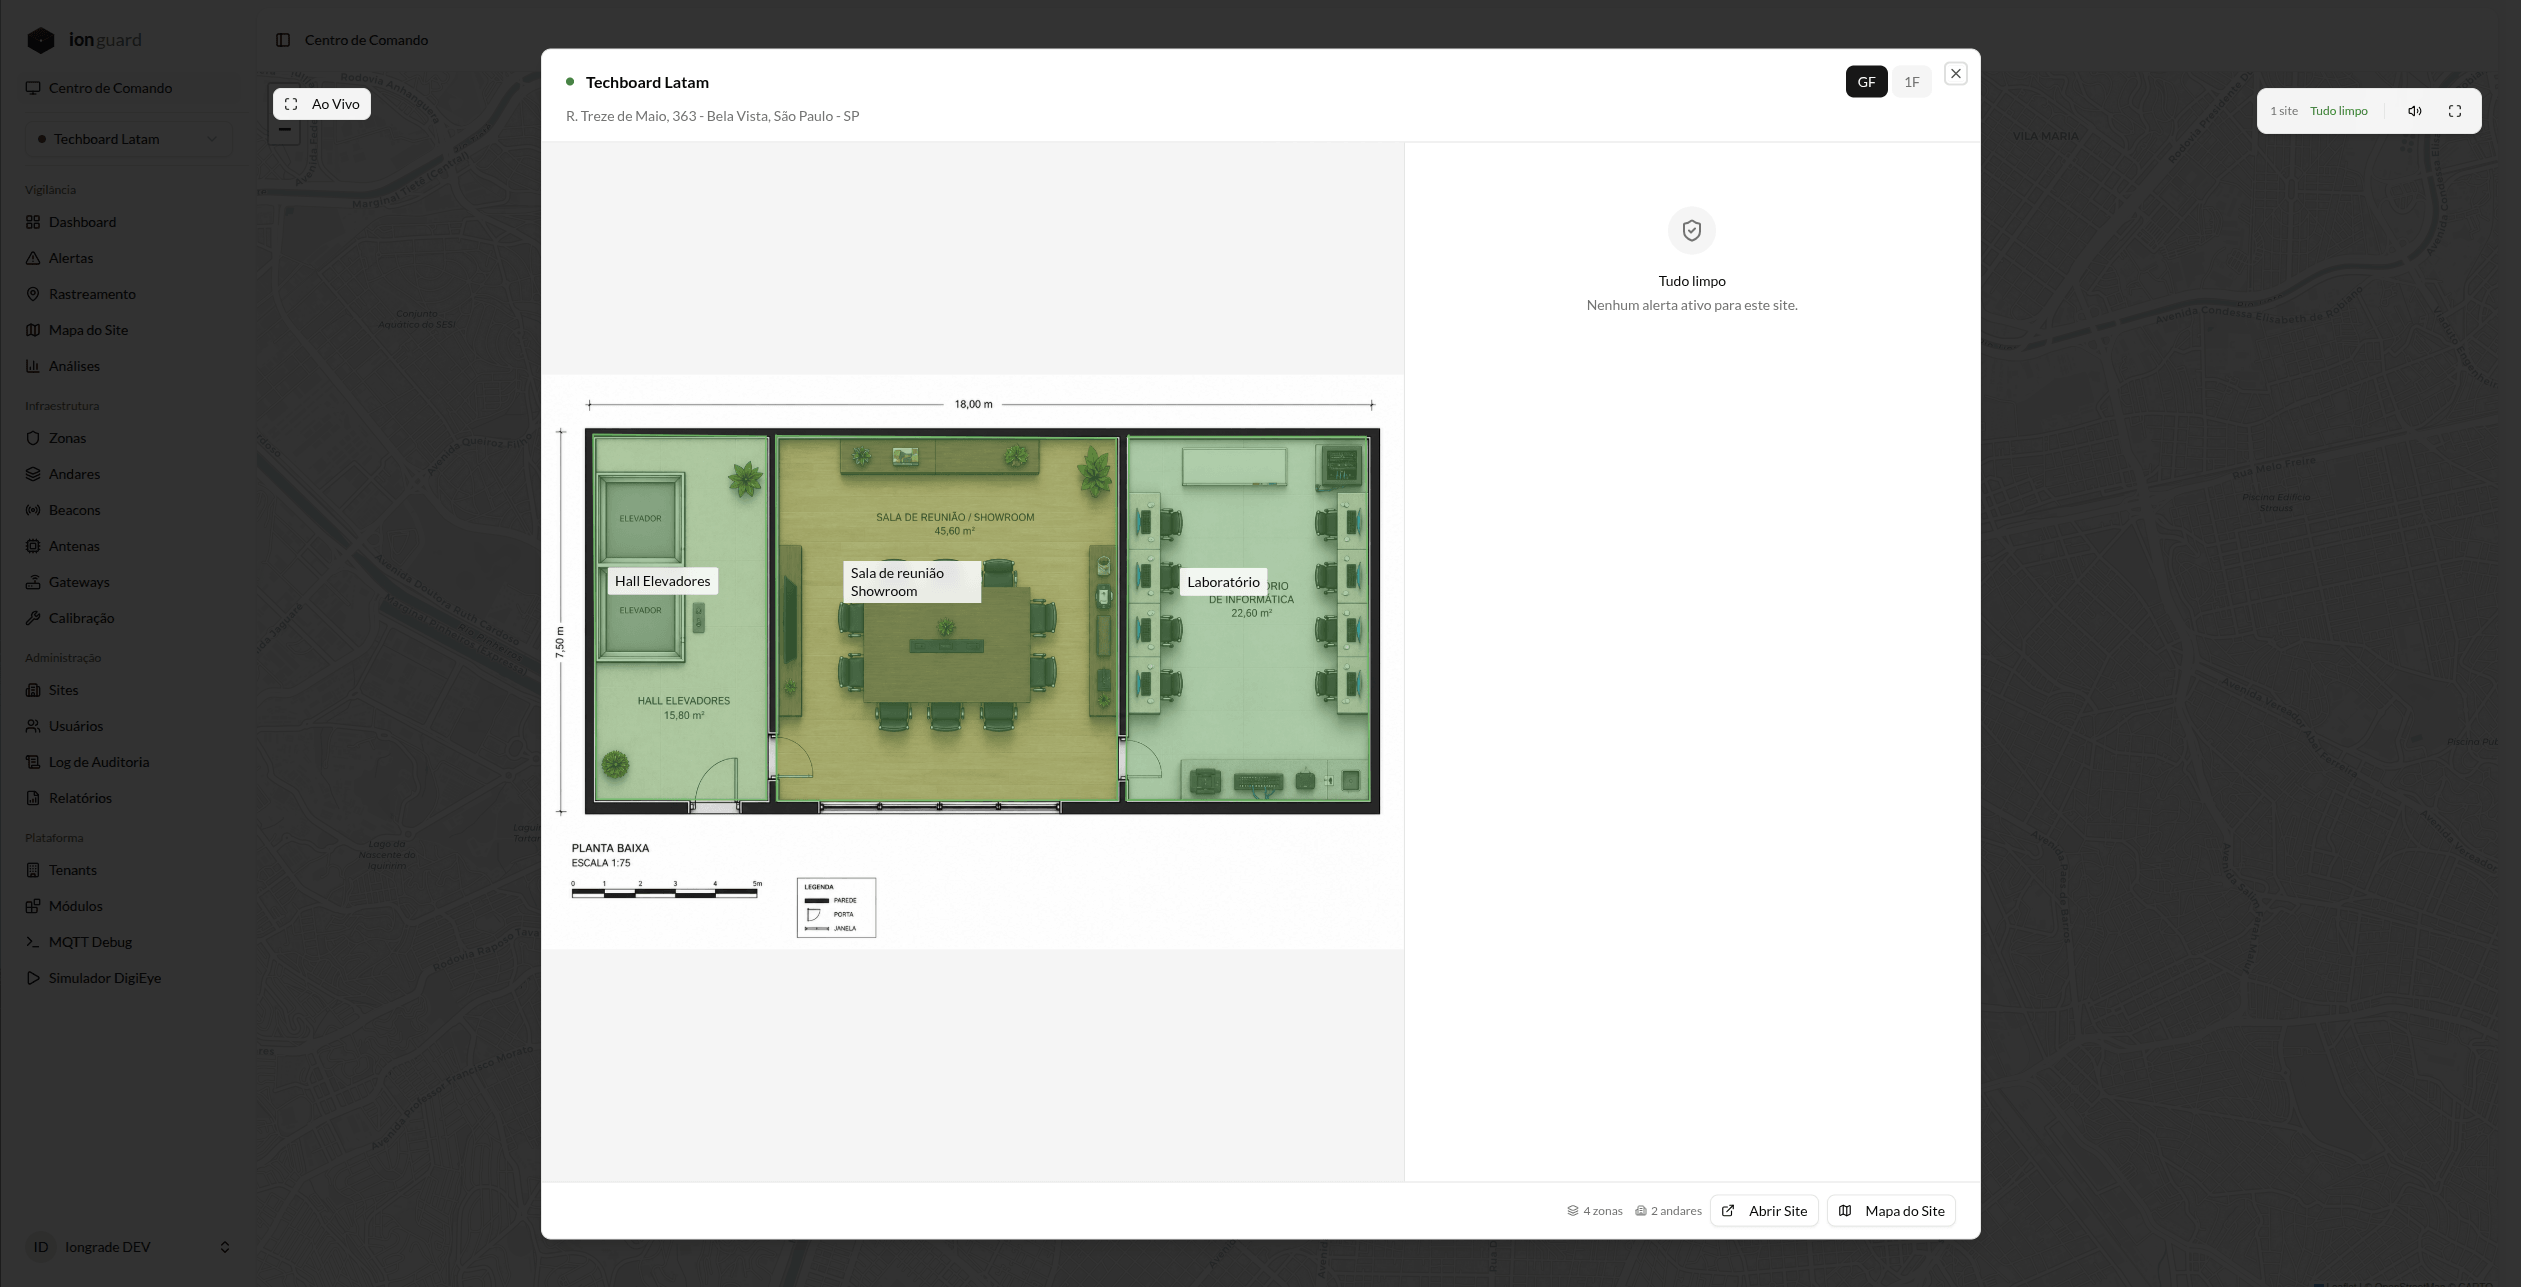
When you click on a site on the map, a side panel opens on the right showing:
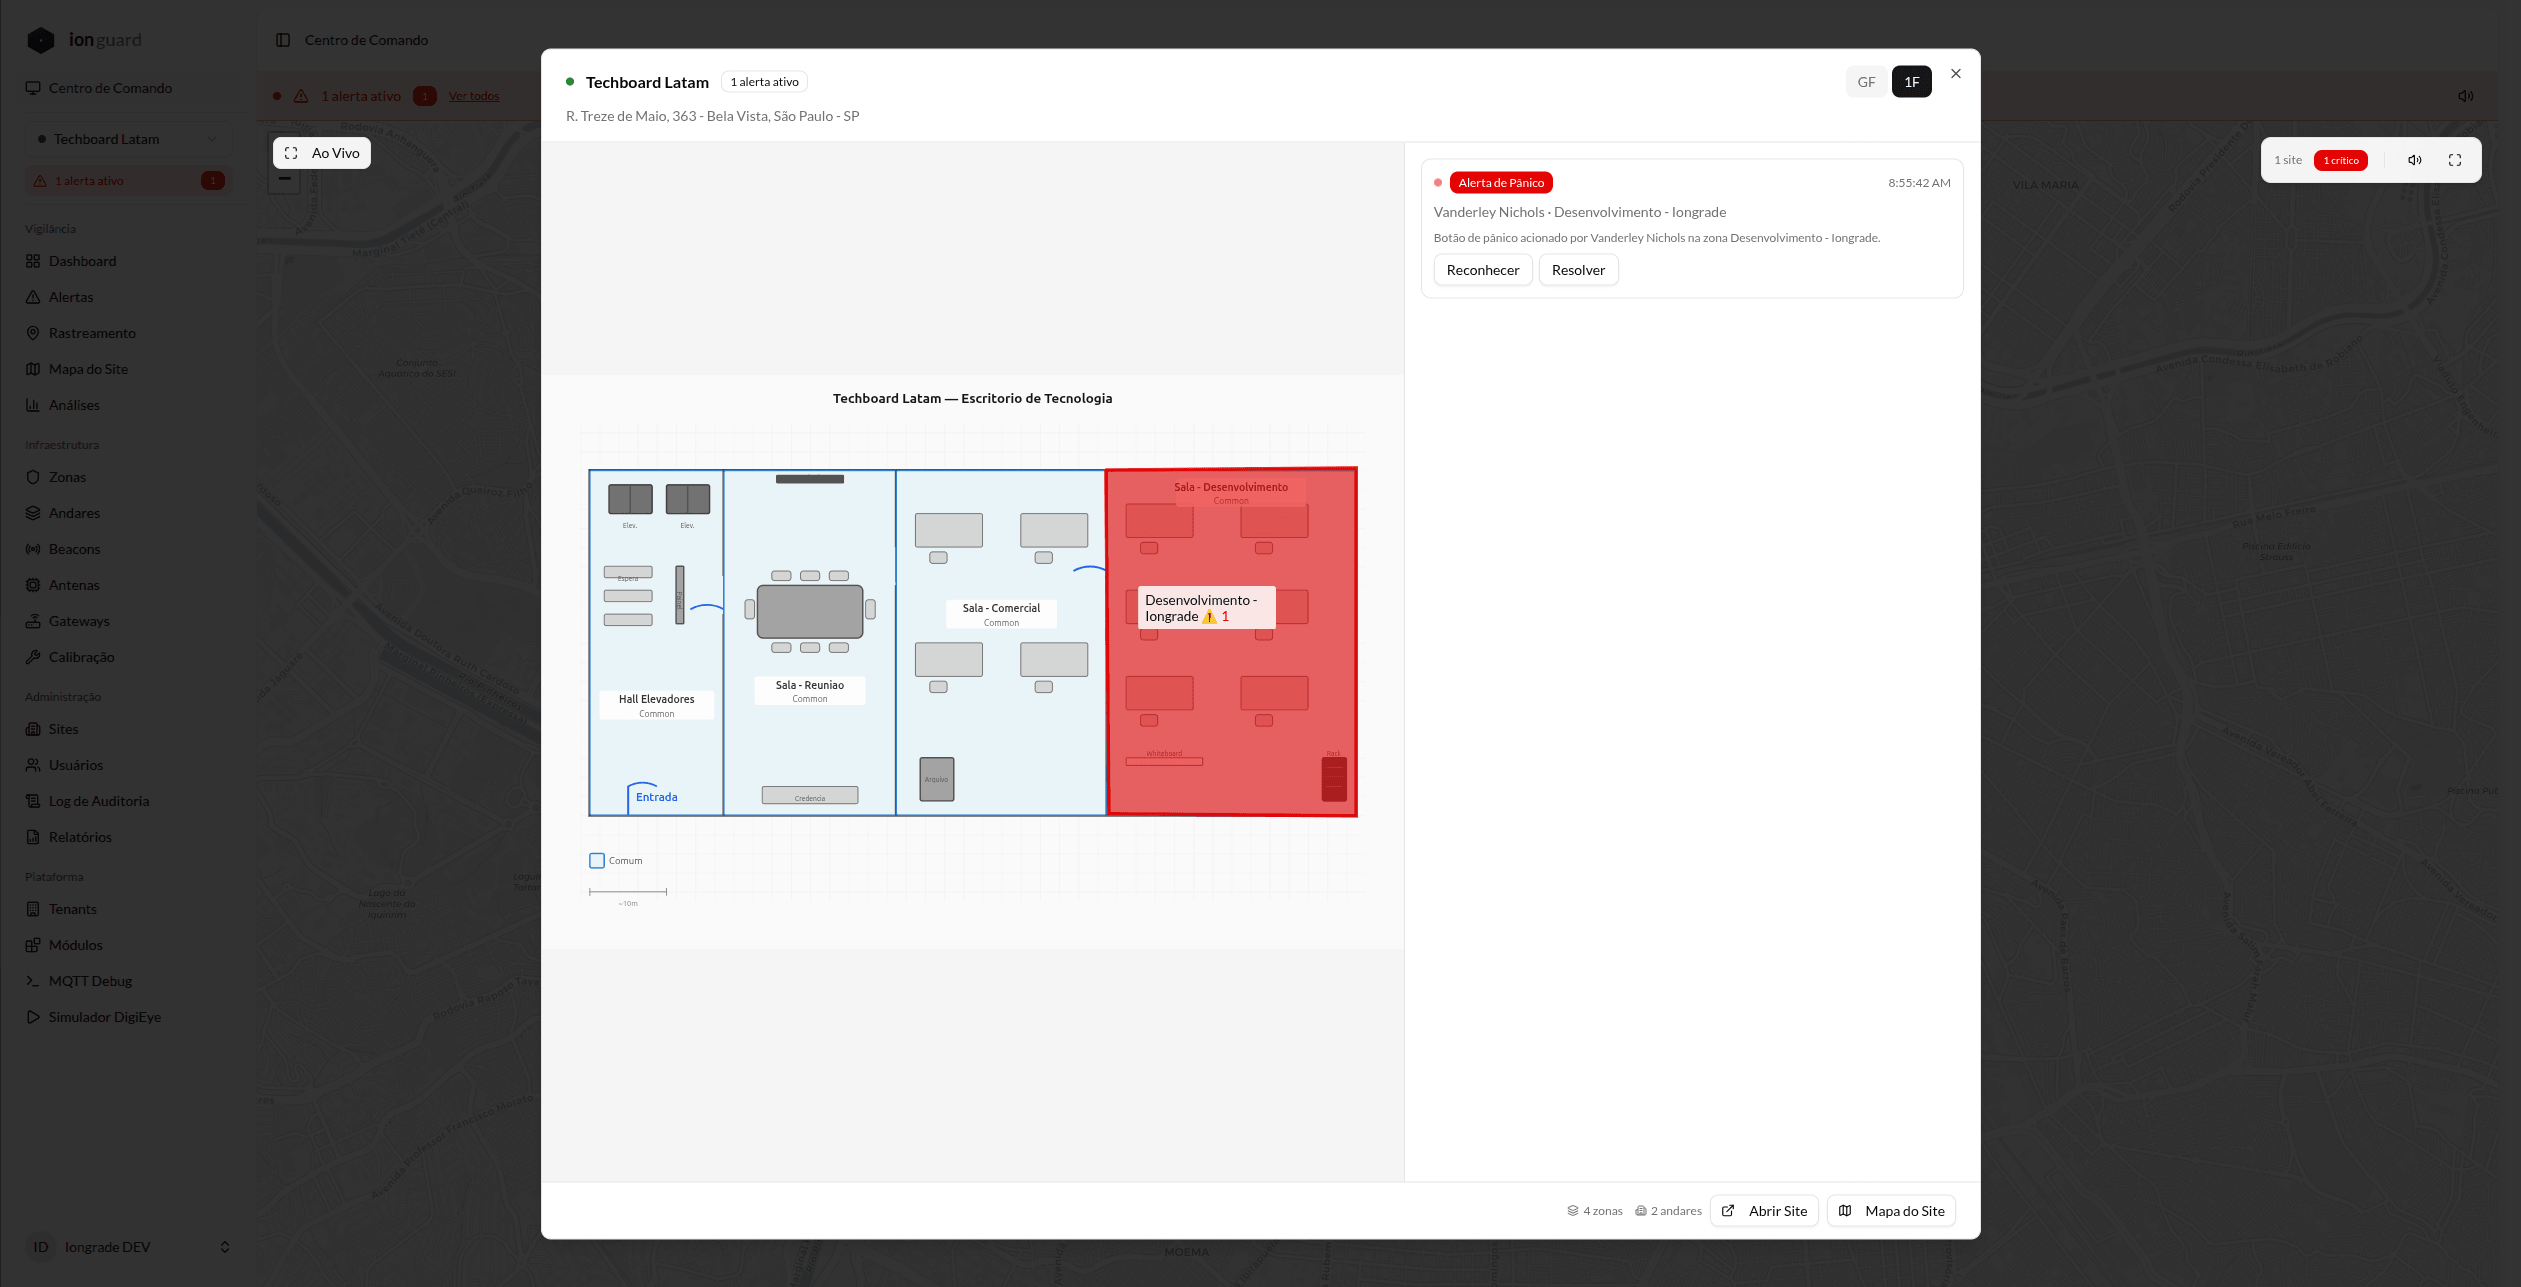
- Site name and count of unresolved alerts
- List of active alerts (up to 10 most recent)
- For each alert: type, severity, zone, time
- Action buttons:
- Acknowledge — With a confirmation dialog
- Resolve — With a field for a resolution note
Actions are applied with optimistic updates — the interface updates immediately while the request is processed in the background.
Live mode
The "Live" button opens the dedicated monitoring view in fullscreen (in the same tab), ideal for dedicated monitors in security operations centers.
Live mode elements
Thin top bar:
- "Command Center" title with a pulsing indicator if there are critical alerts
- Total alert count (colored by severity)
- Live clock with second precision
- Buttons: mute, fullscreen, exit
Map — Occupies the entire central area, same behavior as normal mode.
Bottom status bar:
- Number of monitored sites
- Total unresolved alerts
- Auto-refresh indicator (fallback every 30 seconds)
Connectivity fallback
If the WebSocket connection drops, live mode performs an automatic refresh every 30 seconds to ensure data remains up to date. When the WebSocket reconnects, the timer resets.
Alerts in the Command Center
When there are active alerts, the map highlights the affected sites and displays an alert banner at the top:
The site side panel shows the alerts with visual emphasis and response actions:
Sound notifications
When a new alert is created at any monitored site, a sound alert plays automatically. The sound can be muted using the mute button.
Sound is never the only indicator — visual alerts (color, badge, pulsing animation) always accompany the sound notification. The mute button is keyboard accessible.
Filters
The Command Center accepts filters to refine which alerts are considered. They are applied via URL parameters (there is no filter panel on the screen):
- Alert Status (Active, Acknowledged)
- Alert Type
- Severity (Critical, High, Warning, Info)