Calibration
The Calibration page (route /commissioning) is the fine-tuning tool for the indoor location system of the Synapsys module. It lets you monitor signals in real time, test boundaries between zones, adjust location engine parameters, and validate the health of the installation — all in a single interface.
Navigation path: Calibration menu (available when the Synapsys module is enabled on the site).
Calibration is available to Tenant Admin profiles or higher. Changes to the parameters immediately affect the location calculation of all beacons on the site.
Interface overview
The page is organized into 4 tabs:
| Tab | Function |
|---|---|
| Signal Monitor | Real-time heatmap showing the signal strength (RSSI) between each antenna and beacon |
| Zone Test | Detailed analysis of a specific beacon: assigned zone, confidence, breakdown by antenna |
| Calibration | Adjustment of the site parameters and offset per antenna |
| Verification | Complete diagnostics of the infrastructure, devices, and coverage |
The order of the tabs reflects the recommended workflow: first observe, then test, adjust, and validate.
Calibration is part of the Synapsys module. For an overview of the module and its sub-resources, see Synapsys Module and the Tracking overview.
Signal Monitor
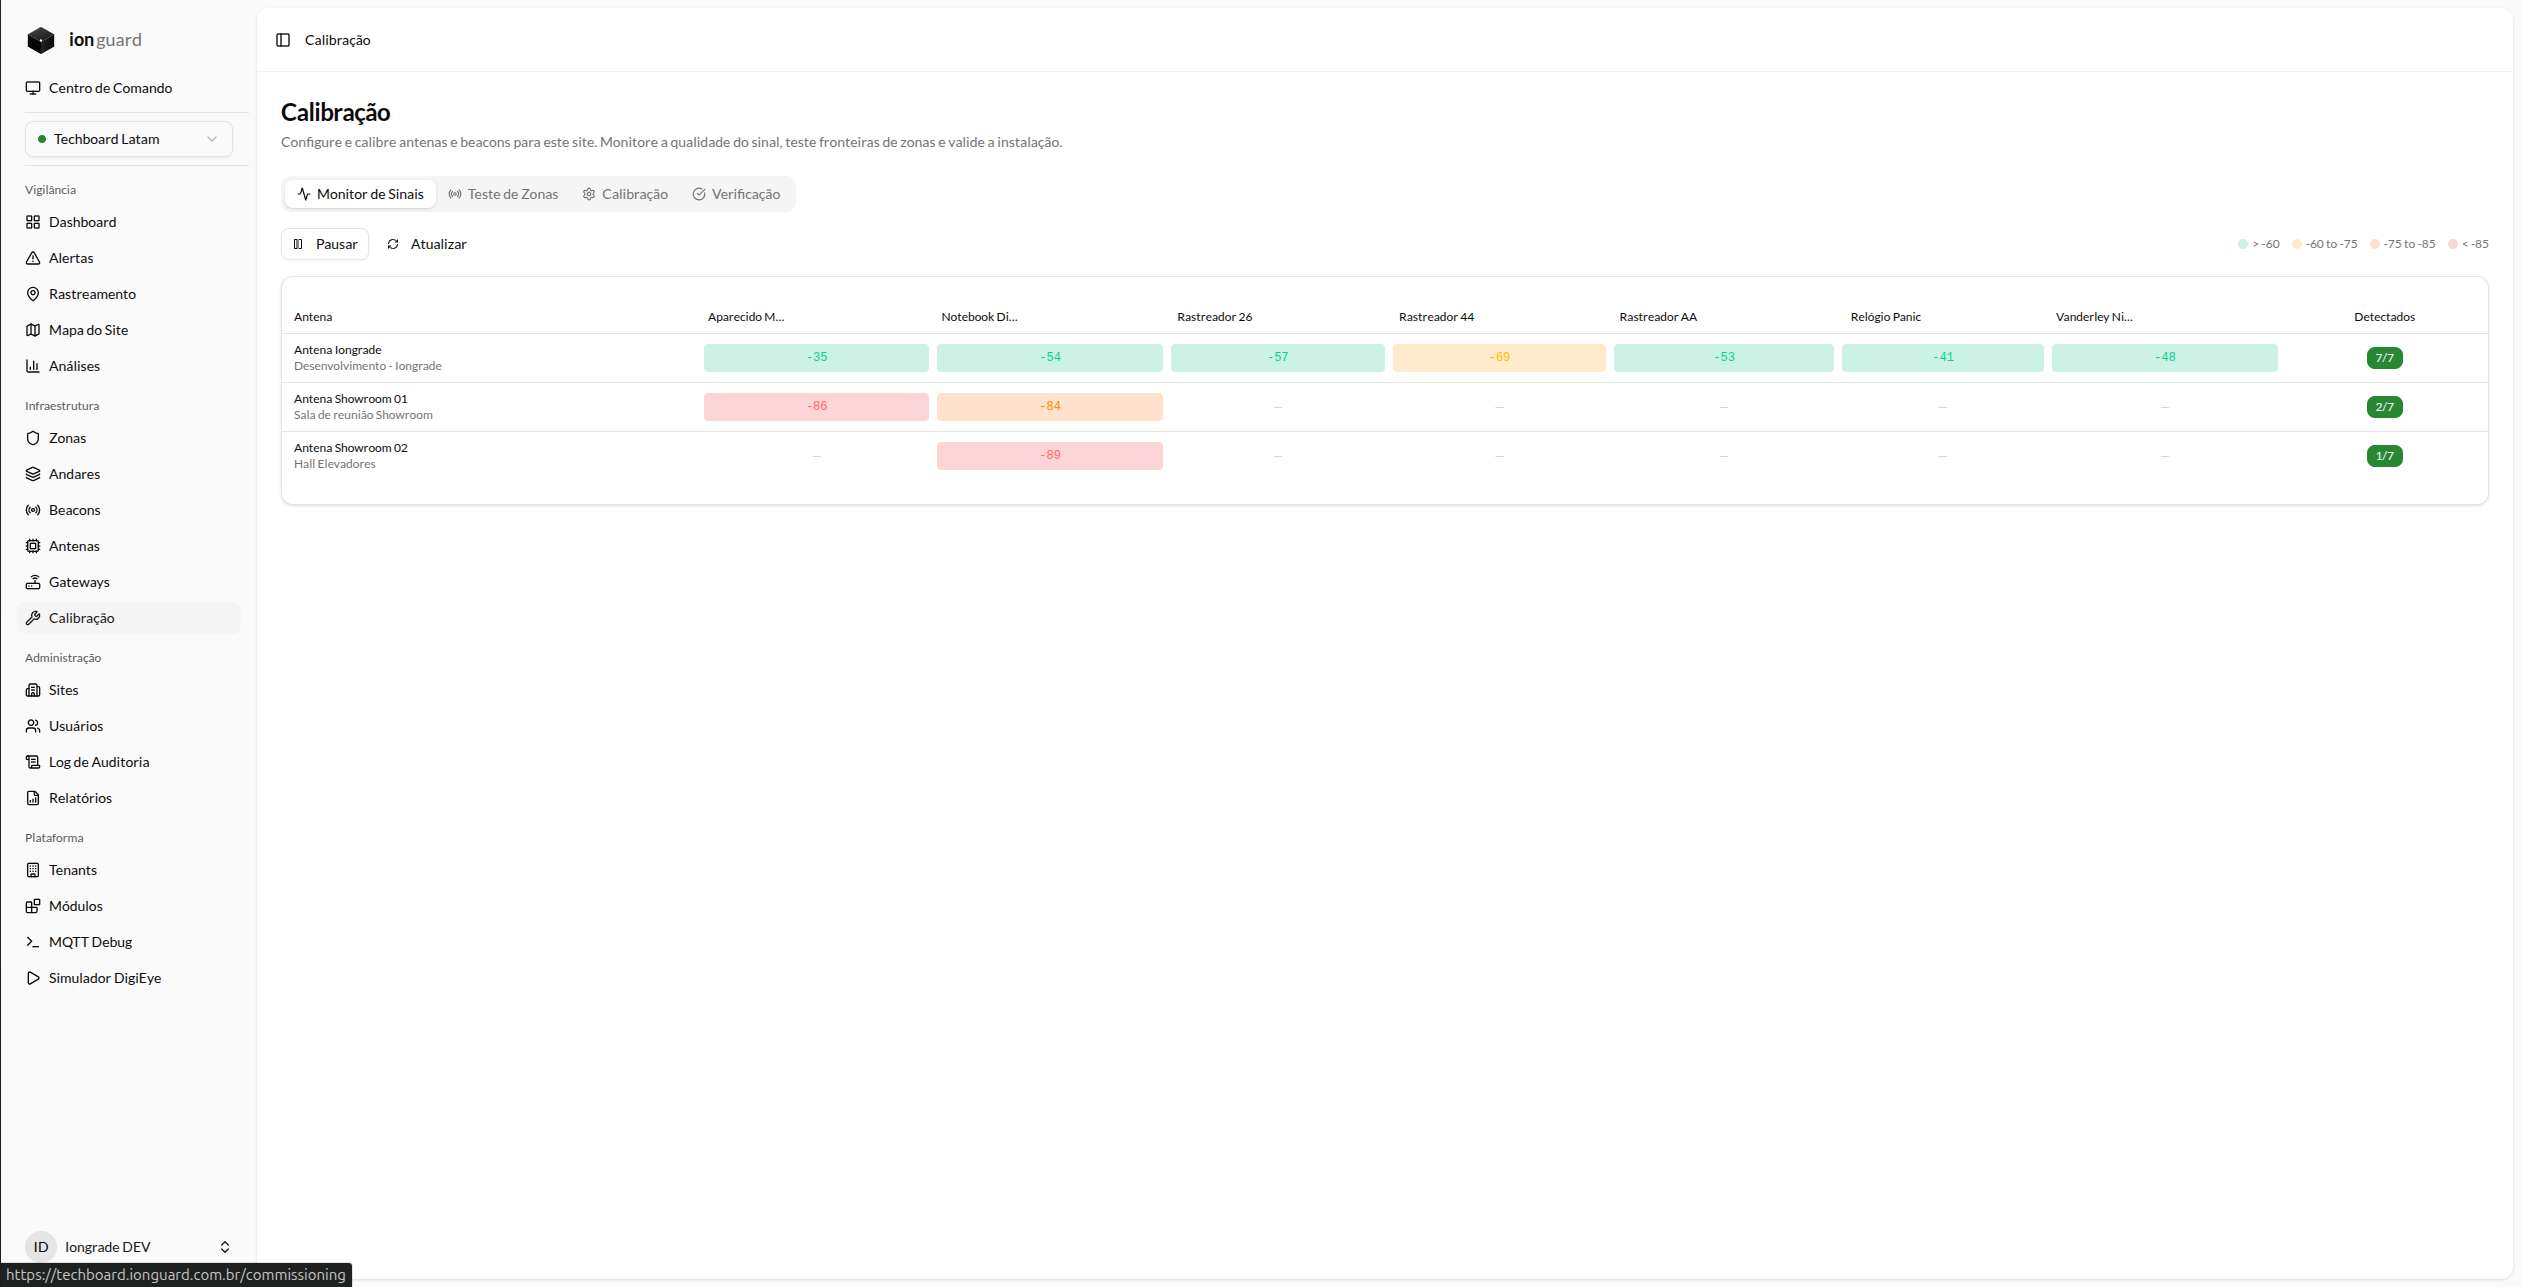
The Signal Monitor displays a real-time matrix crossing antennas (rows) with beacons (columns). Each cell shows the median RSSI (in dBm) captured by the antenna for that beacon.
The matrix updates automatically every 2 seconds. Use the Pause and Refresh buttons to control the update.
Reading the heatmap
Cells are colored according to signal strength:
| Color | RSSI range | Meaning |
|---|---|---|
| Green | ≥ -60 dBm | Strong signal — beacon close to the antenna |
| No color | -60 to -75 dBm | Good signal — beacon at medium distance |
| Orange | -75 to -85 dBm | Weak signal — beacon far away or with an obstacle |
| Red | < -85 dBm | Very weak signal — at the detection limit |
The Detected column indicates how many beacons each antenna is seeing (e.g., 3/3 means all 3 beacons are being captured).
What to watch for
- All antennas should detect all beacons — if an antenna shows
0/3, it may be offline or poorly positioned - The antenna of the correct zone should have the strongest RSSI — if a beacon is in the "Rest zone", the antenna of that zone should show the greenest cell
- Difference between antennas — the greater the RSSI difference between the dominant antenna and the others, the more precise the location will be
Use the Signal Monitor as the first step when installing or repositioning antennas. It gives a quick overview of how the signals are distributed before getting into per-beacon details.
Zone Test
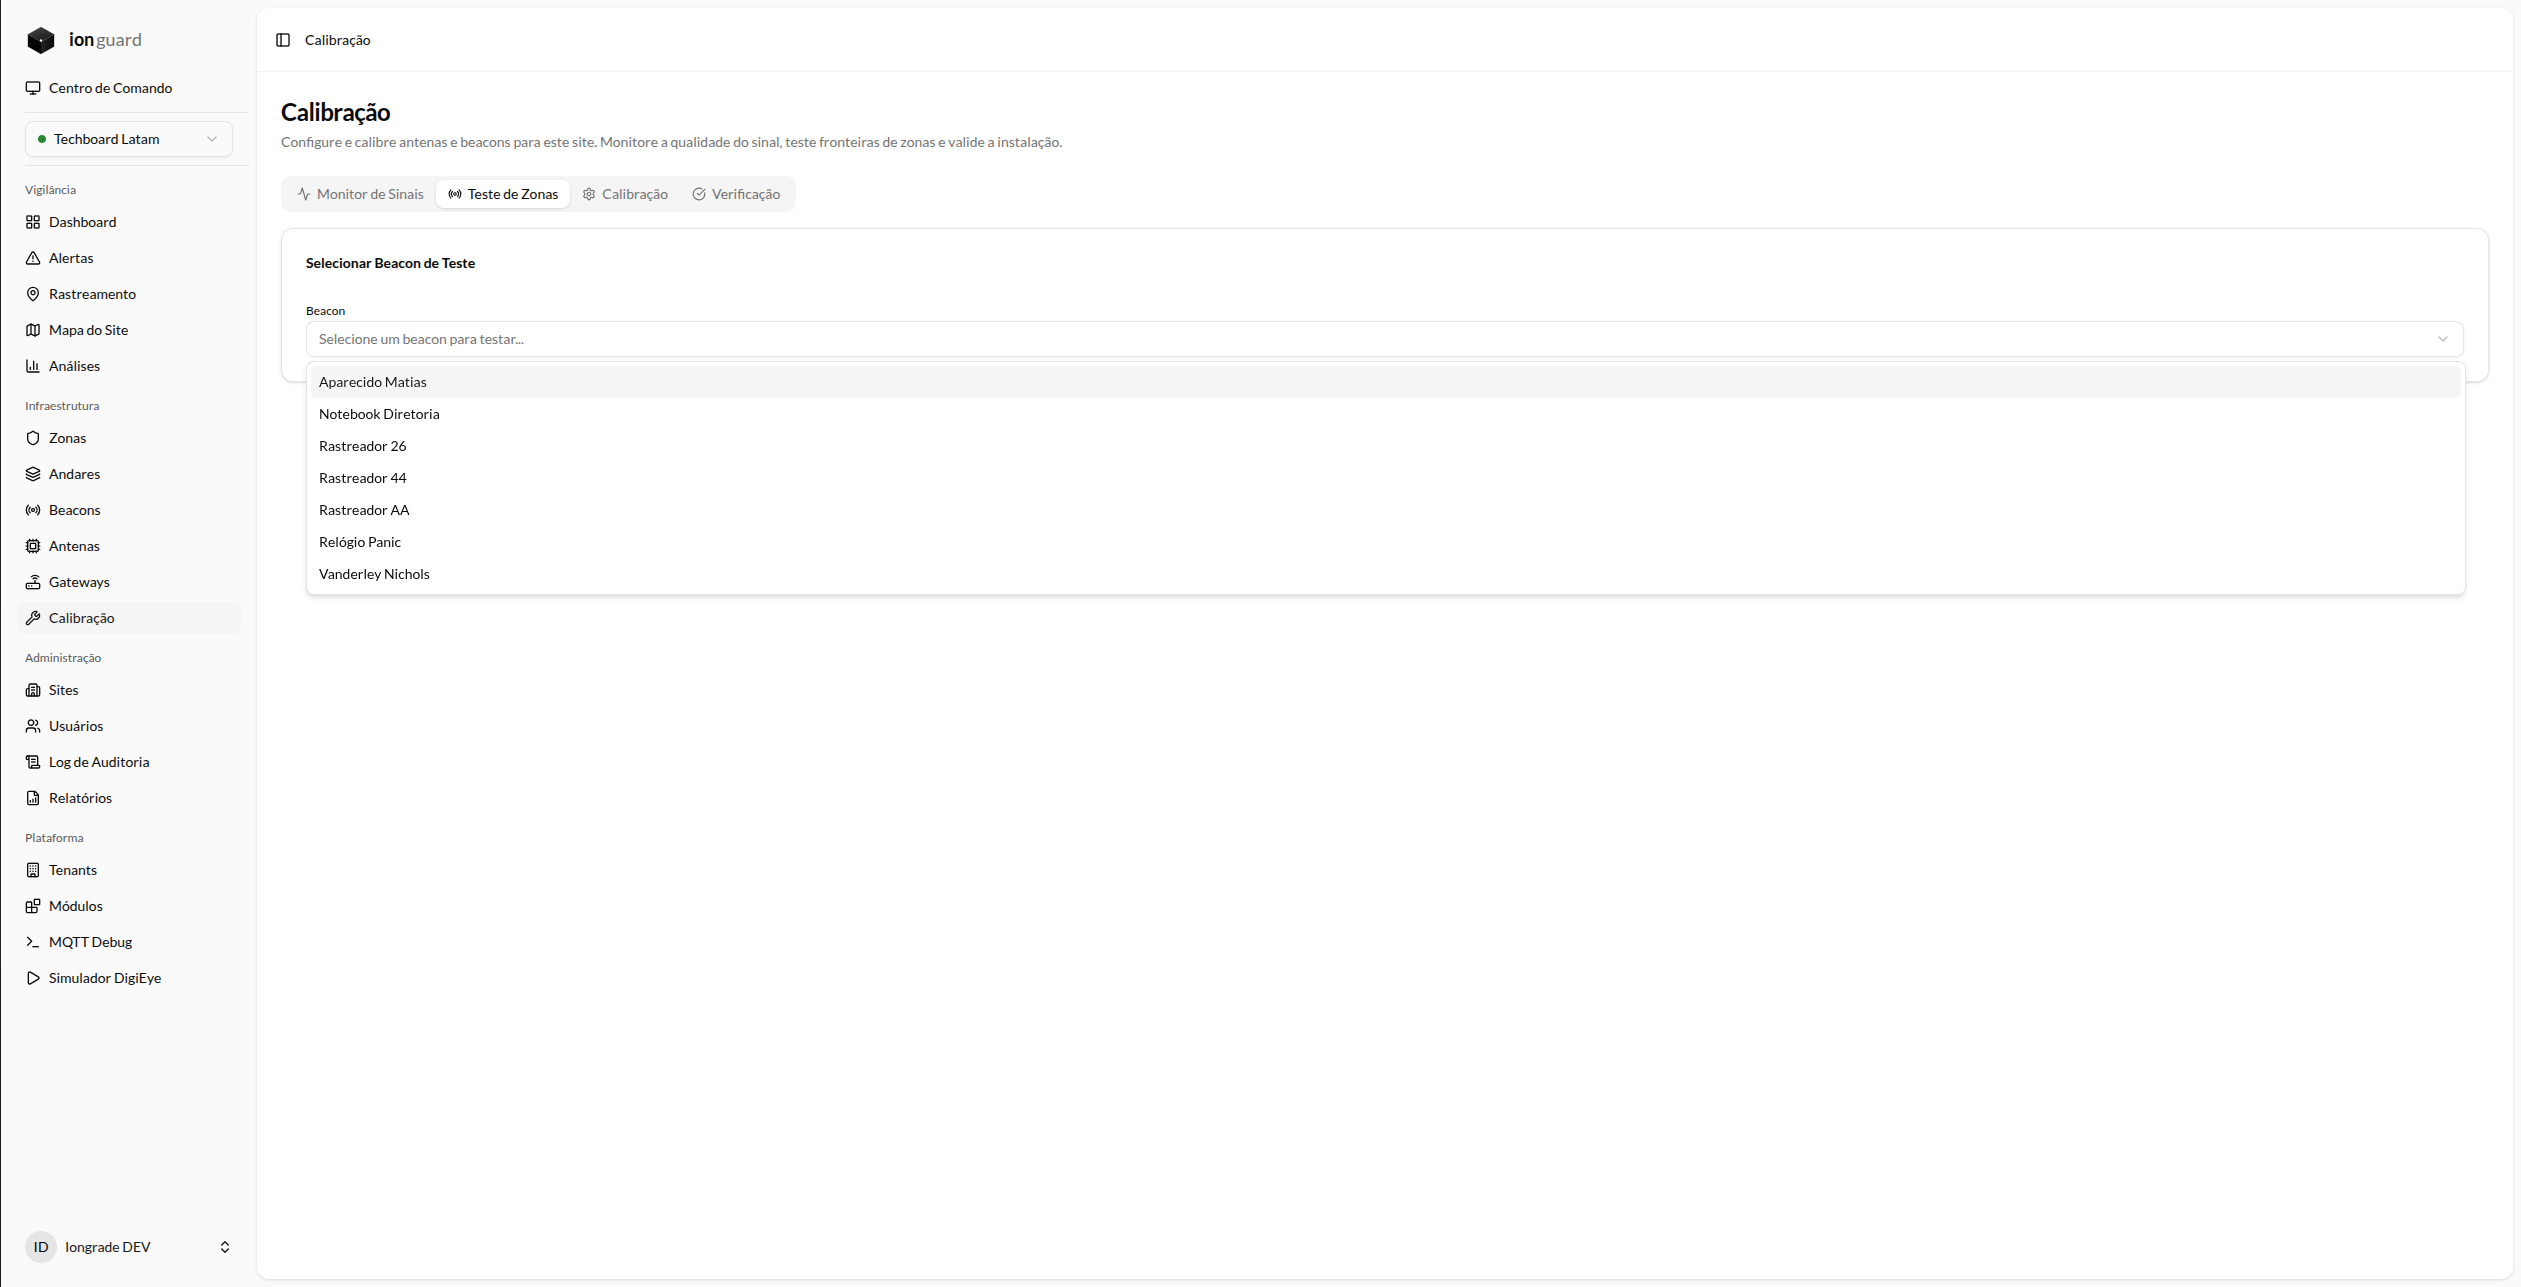
The Zone Test is the main validation tool. Select a beacon in the dropdown and the system displays in real time (updates every 2 seconds):
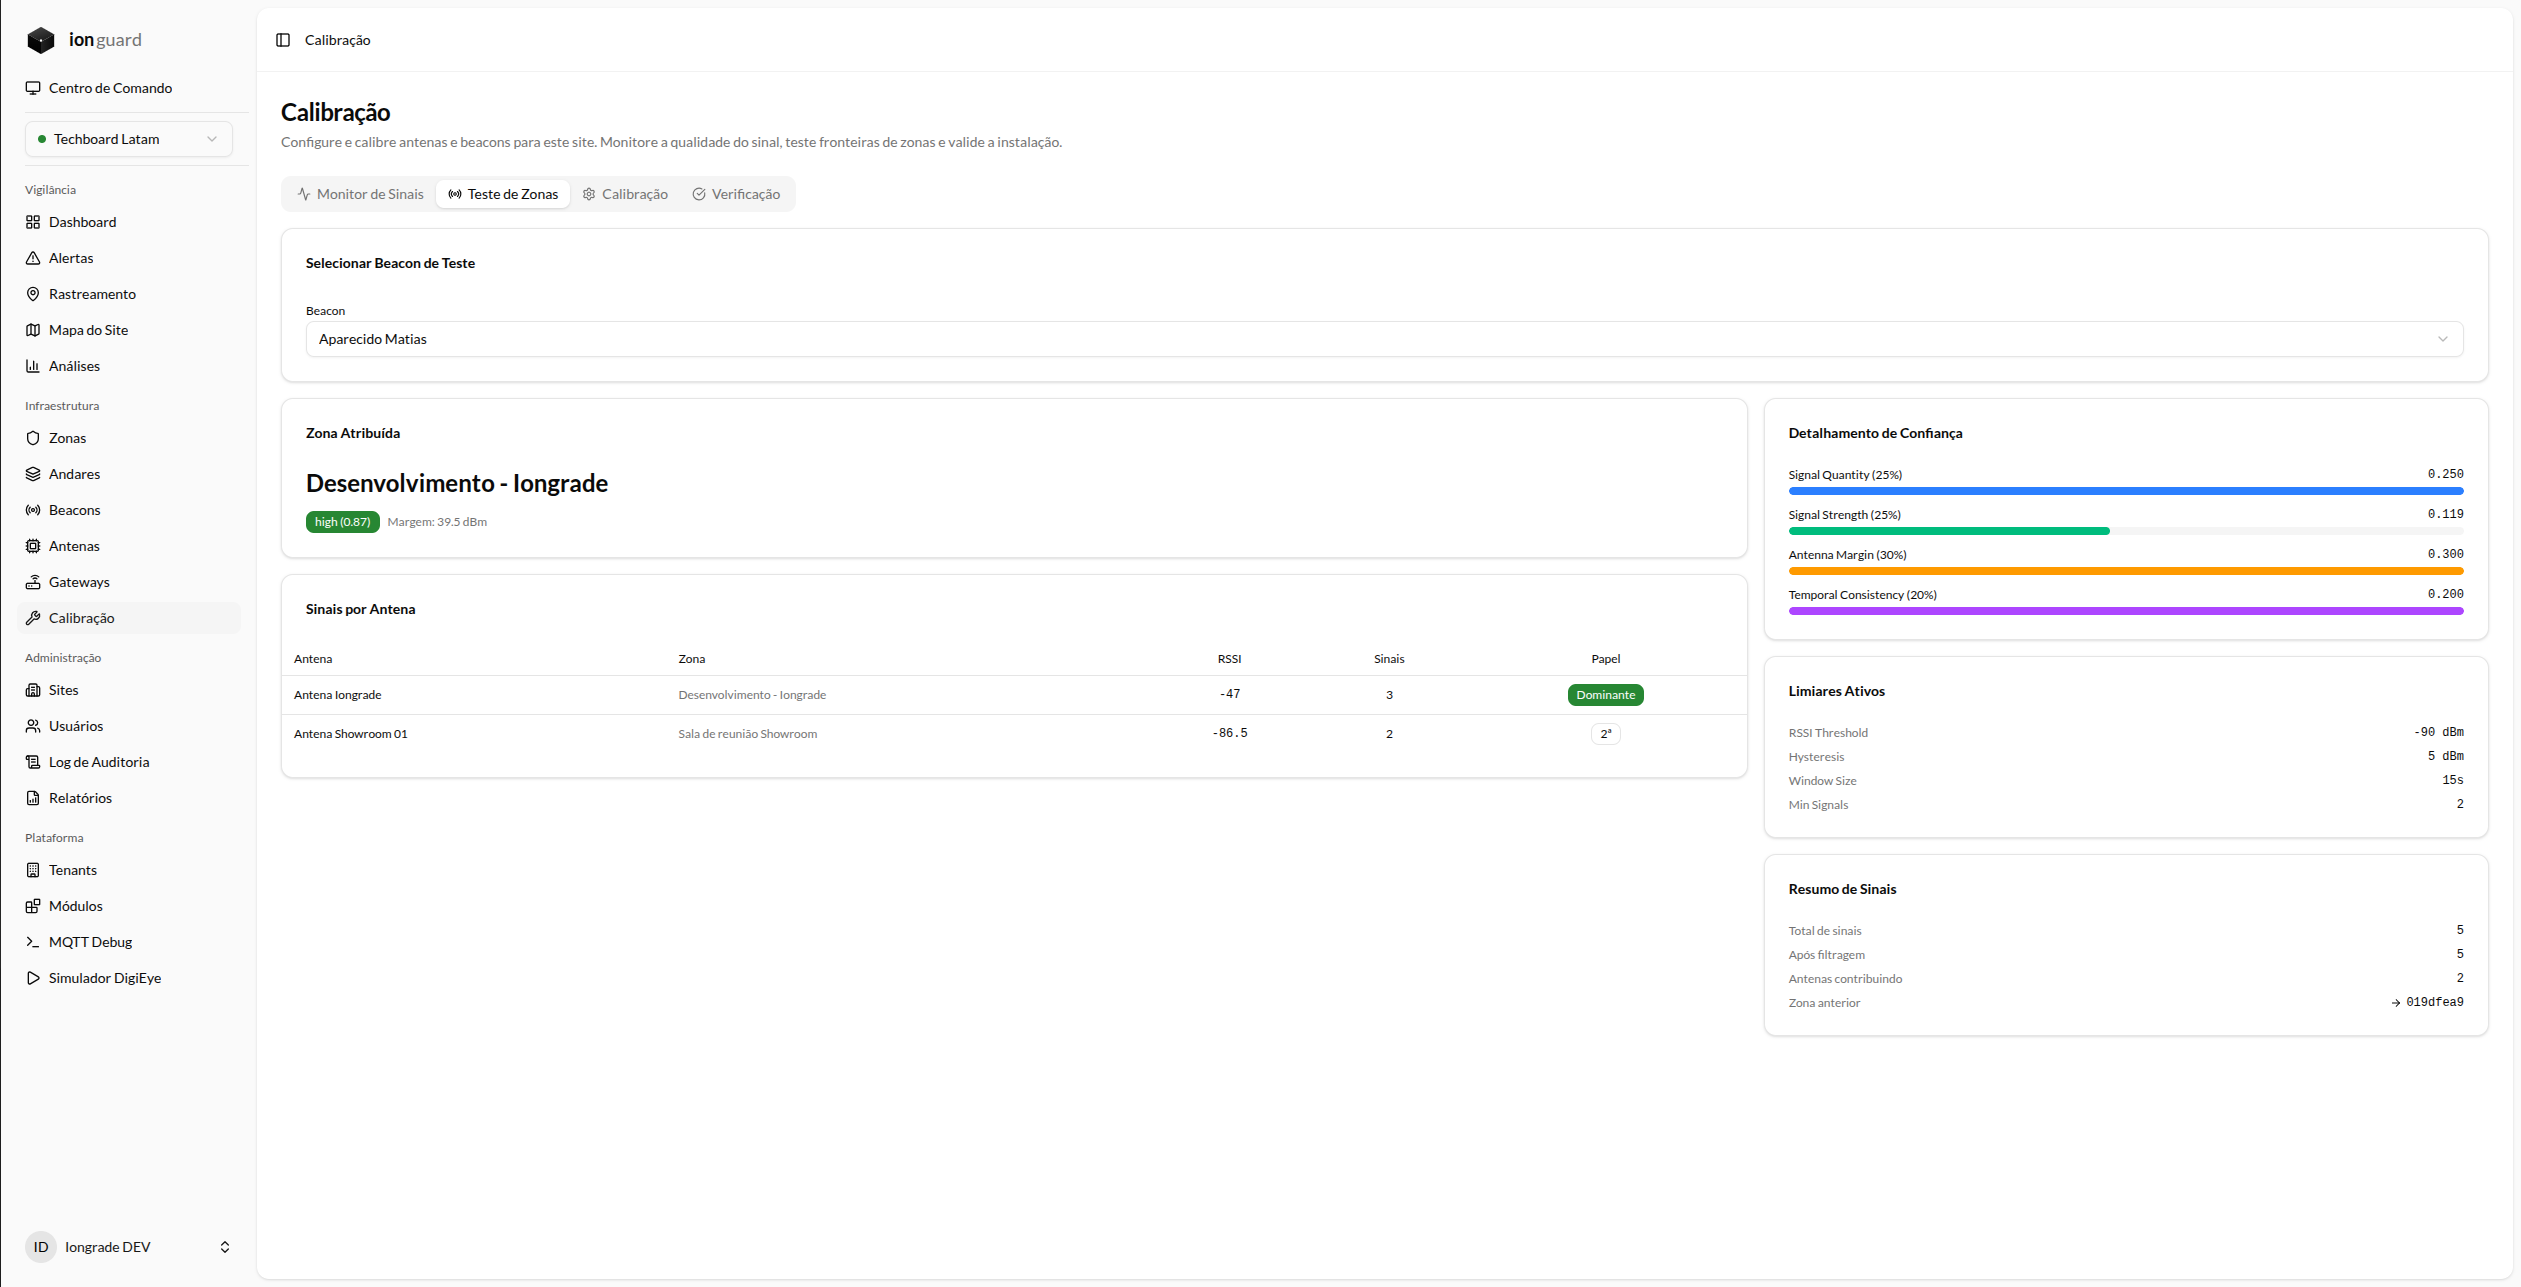
Assigned zone
Shows the zone calculated by the location engine, accompanied by:
- Confidence badge — indicates the certainty level of the location:
high(≥ 0.70) — Reliable locationmedium(0.40 to 0.69) — Reasonable, may fluctuatelow(< 0.40) — Unreliable, likely imprecision
- Margin — RSSI difference (in dBm) between the dominant antenna and the second. The larger it is, the more certainty
Signals per antenna
Table showing each antenna that is capturing the beacon:
| Column | Meaning |
|---|---|
| Antenna | Name of the antenna |
| Zone | Zone to which the antenna is assigned |
| RSSI | Median signal strength (dBm) — closer to 0 = stronger |
| Signals | Number of signals captured in the time window |
| Role | Dominant (antenna with the strongest RSSI) or relative position (2nd, 3rd...) |
Confidence breakdown
Side panel that decomposes the confidence score into 4 factors:
| Factor | Weight | What it measures |
|---|---|---|
| Signal Quantity | 25% | Is the antenna capturing enough signals? Based on the Min Signals parameter |
| Signal Strength | 25% | Is the dominant signal strong enough? Compares the RSSI with -90 dBm |
| Antenna Margin | 30% | Is the difference between antennas large enough? Compares the margin with the Hysteresis |
| Temporal Consistency | 20% | Is the beacon still in the same zone as the previous reading? Stability |
Each factor displays a progress bar and the numeric value (0 to maximum weight). The sum of the 4 factors is the final score.
The weights and the confidence calculation are the same ones used by the Location Engine in production. See Tracking for the breakdown of the factors.
Active thresholds
Shows the calibration parameters in use for this site. If there are overrides configured on the Calibration tab, the custom values appear here. Otherwise, it displays the system defaults.
Signal summary
Statistics of the current reading:
| Field | Meaning |
|---|---|
| Total signals | Signals received from all antennas in the time window |
| After filtering | Signals that passed the RSSI Threshold filter |
| Contributing antennas | How many antennas detected the beacon |
| Previous zone | Reference of the last calculated zone (used in the Temporal Consistency factor) |
To validate where the system understands that one zone ends and another begins:
- Select a beacon in the Zone Test
- Physically move the beacon from the current zone toward the adjacent zone
- Stop every ~1 meter for 15-20 seconds (the
Window Sizetime) - Observe the margin decreasing as the beacon approaches the boundary
- When the margin drops below the Hysteresis (default: 5 dBm), the system keeps the previous zone to avoid fluctuation
- The zone switch happens when the other antenna becomes clearly dominant
The point where the switch occurs is the effective boundary — compare it with the desired physical boundary (door, partition) and adjust the offsets on the Calibration tab if necessary.
Calibration
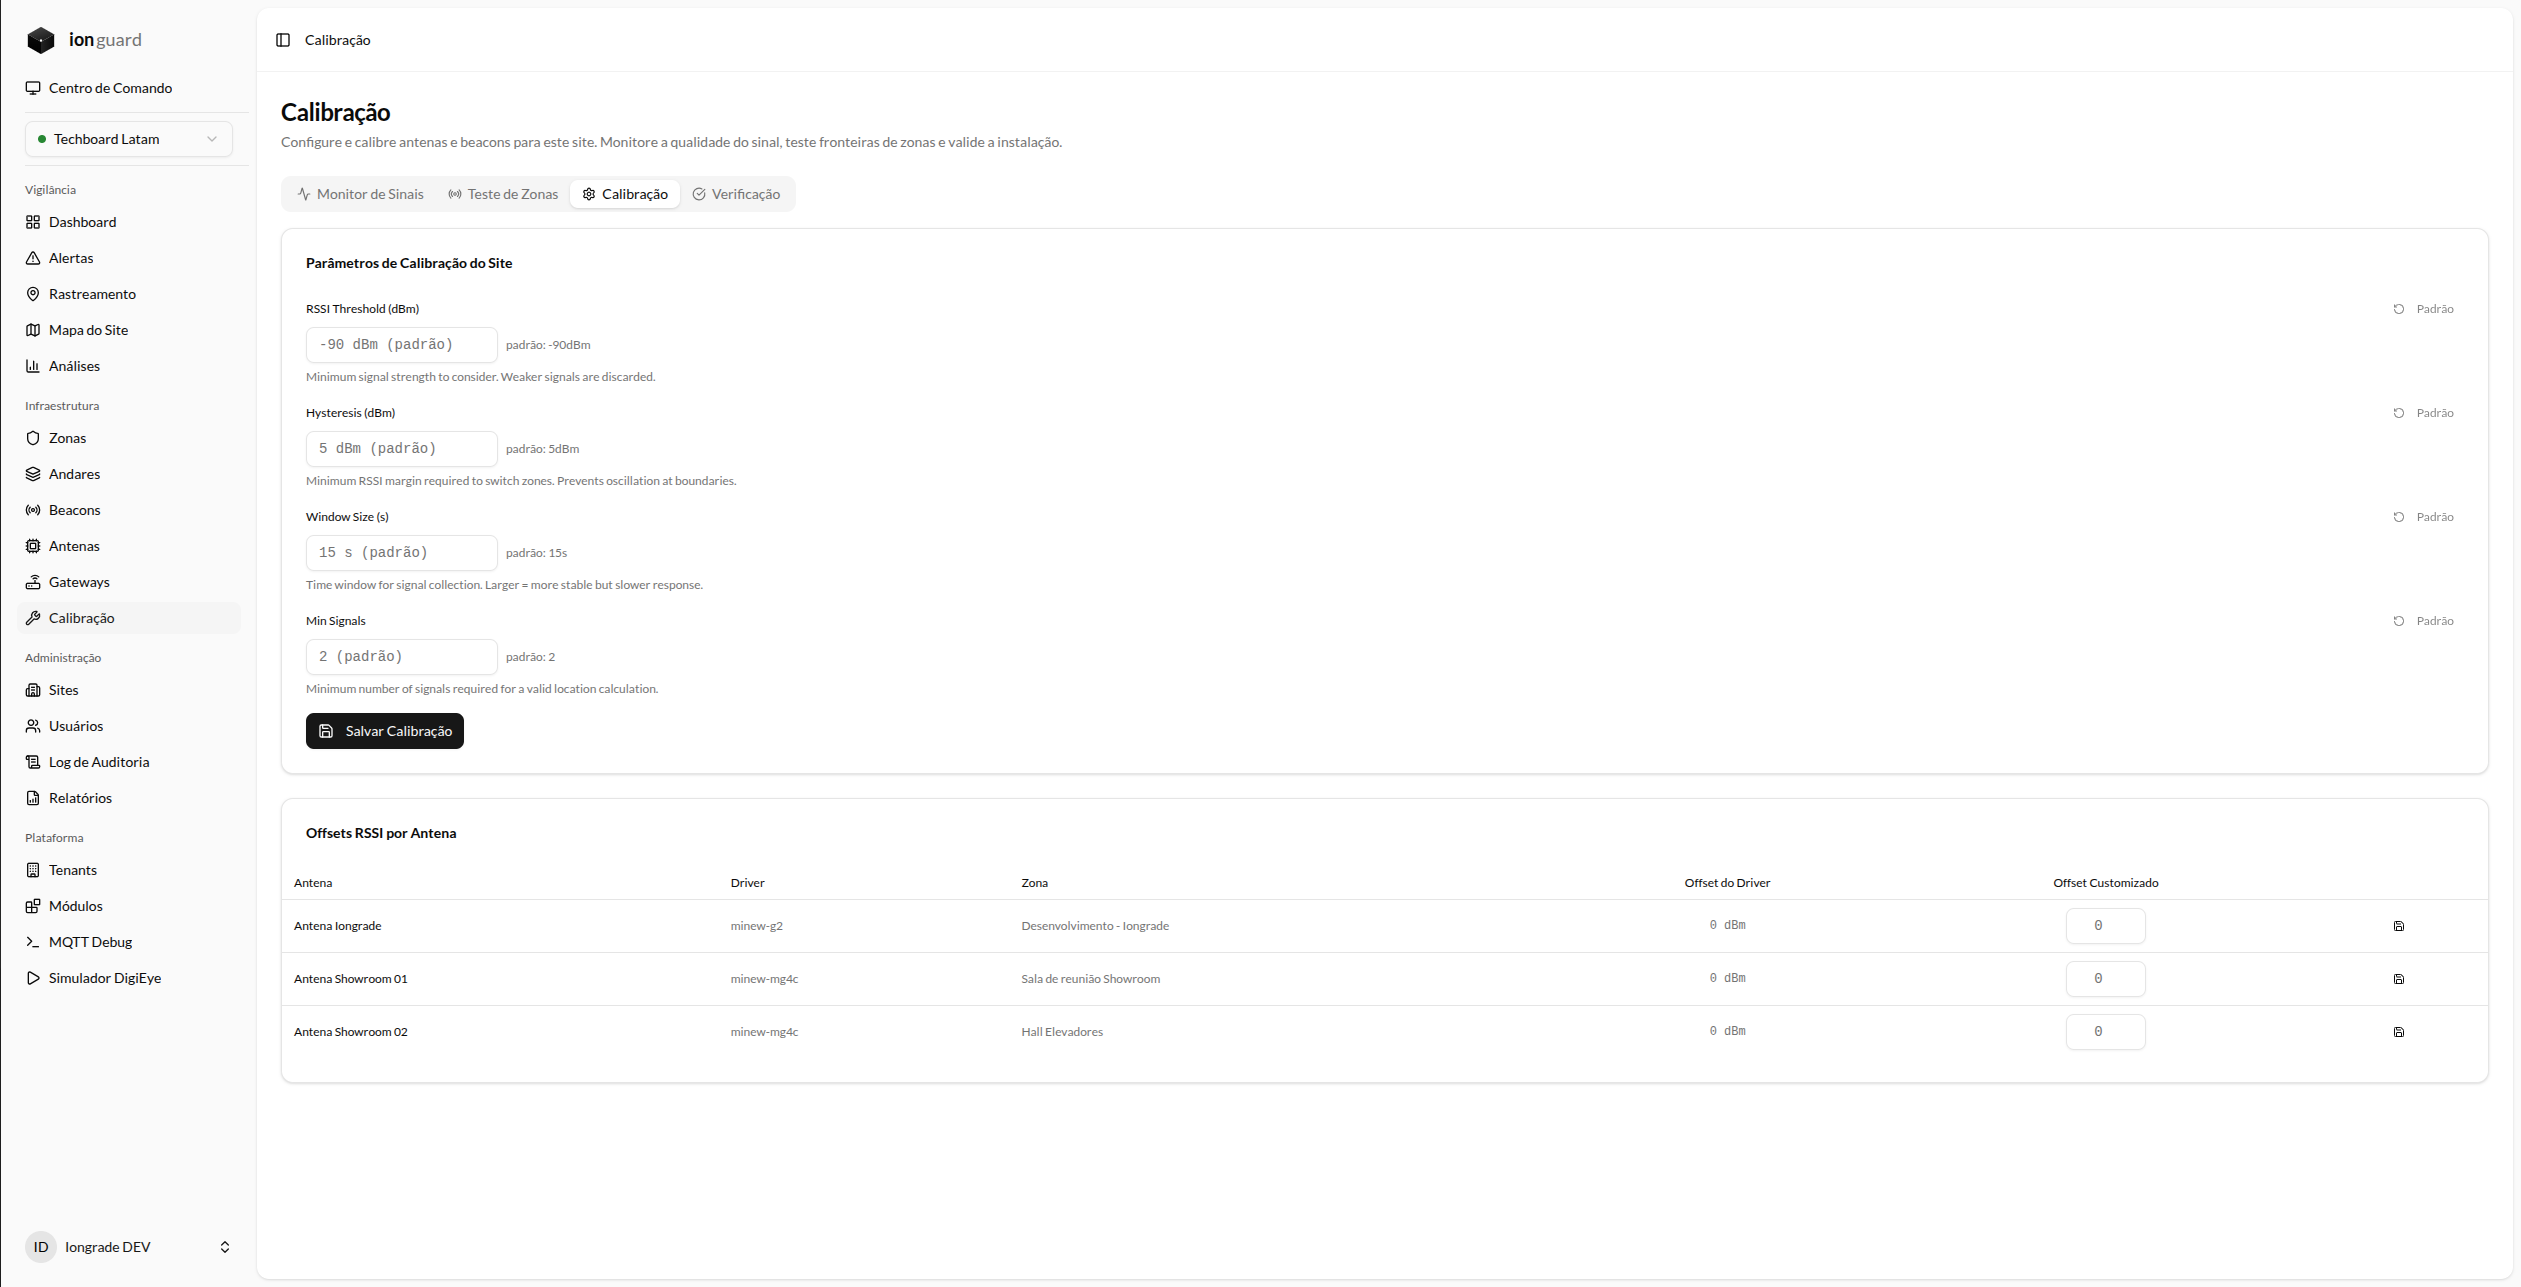
The Calibration tab contains two configuration blocks: site parameters and offsets per antenna.
Site calibration parameters
These parameters control how the location engine processes signals for the entire site. Each field shows the default value next to it and has a "Default" button to restore the original value.
| Parameter | Range | Default | What it controls |
|---|---|---|---|
| RSSI Threshold (dBm) | -100 to -50 | -90 | Signals weaker than this value are discarded. Raising the value filters out more weak signals, keeping only the strong ones |
| Hysteresis (dBm) | 0 to 20 | 5 | Minimum margin between antennas to switch zones. High values reduce fluctuation but delay motion detection |
| Window Size (s) | 5 to 60 | 15 | Time window (seconds) for signal collection. Larger = more stable location, but slower response |
| Min Signals | 1 to 10 | 2 | Minimum number of signals to calculate location. More signals = more reliable, but slower |
The default values above are those of the location engine (config/location.php): RSSI Threshold -90 dBm, Hysteresis 5 dBm, Window Size 15 s, Min Signals 2. Adjustments made here apply per-site overrides on top of these defaults.
After adjusting, click "Save Calibration". The changes take effect immediately.
Changes to the parameters affect all beacons on the site simultaneously. Adjust one parameter at a time and validate in the Zone Test before changing another.
RSSI offsets per antenna
Table that lets you apply an individual fine adjustment per antenna. Each antenna displays:
| Column | Meaning |
|---|---|
| Antenna | Name of the antenna |
| Driver | Hardware driver of the antenna (e.g., minew-mg4c, minew-g2) |
| Zone | Zone assigned to the antenna |
| Driver Offset | Automatic adjustment applied by the hardware driver (read-only) |
| Custom Offset | Manual adjustment in dBm (-20 to +20) that you can configure |
The offset is added to the RSSI read by the antenna. In practice:
- Negative offset (e.g., -5): reduces the effective range of the antenna — the beacon needs to be closer to be assigned to that zone
- Positive offset (e.g., +5): extends the effective range — useful for antennas that read weaker due to positioning or a physical obstacle (walls, shelves)
- An antenna reads too strong and "pulls" beacons from neighboring zones → apply a negative offset
- An antenna is behind an obstacle and reads weaker than it should → apply a positive offset
- Start with adjustments of ±3 to ±5 dBm and observe the result in the Zone Test
Verification
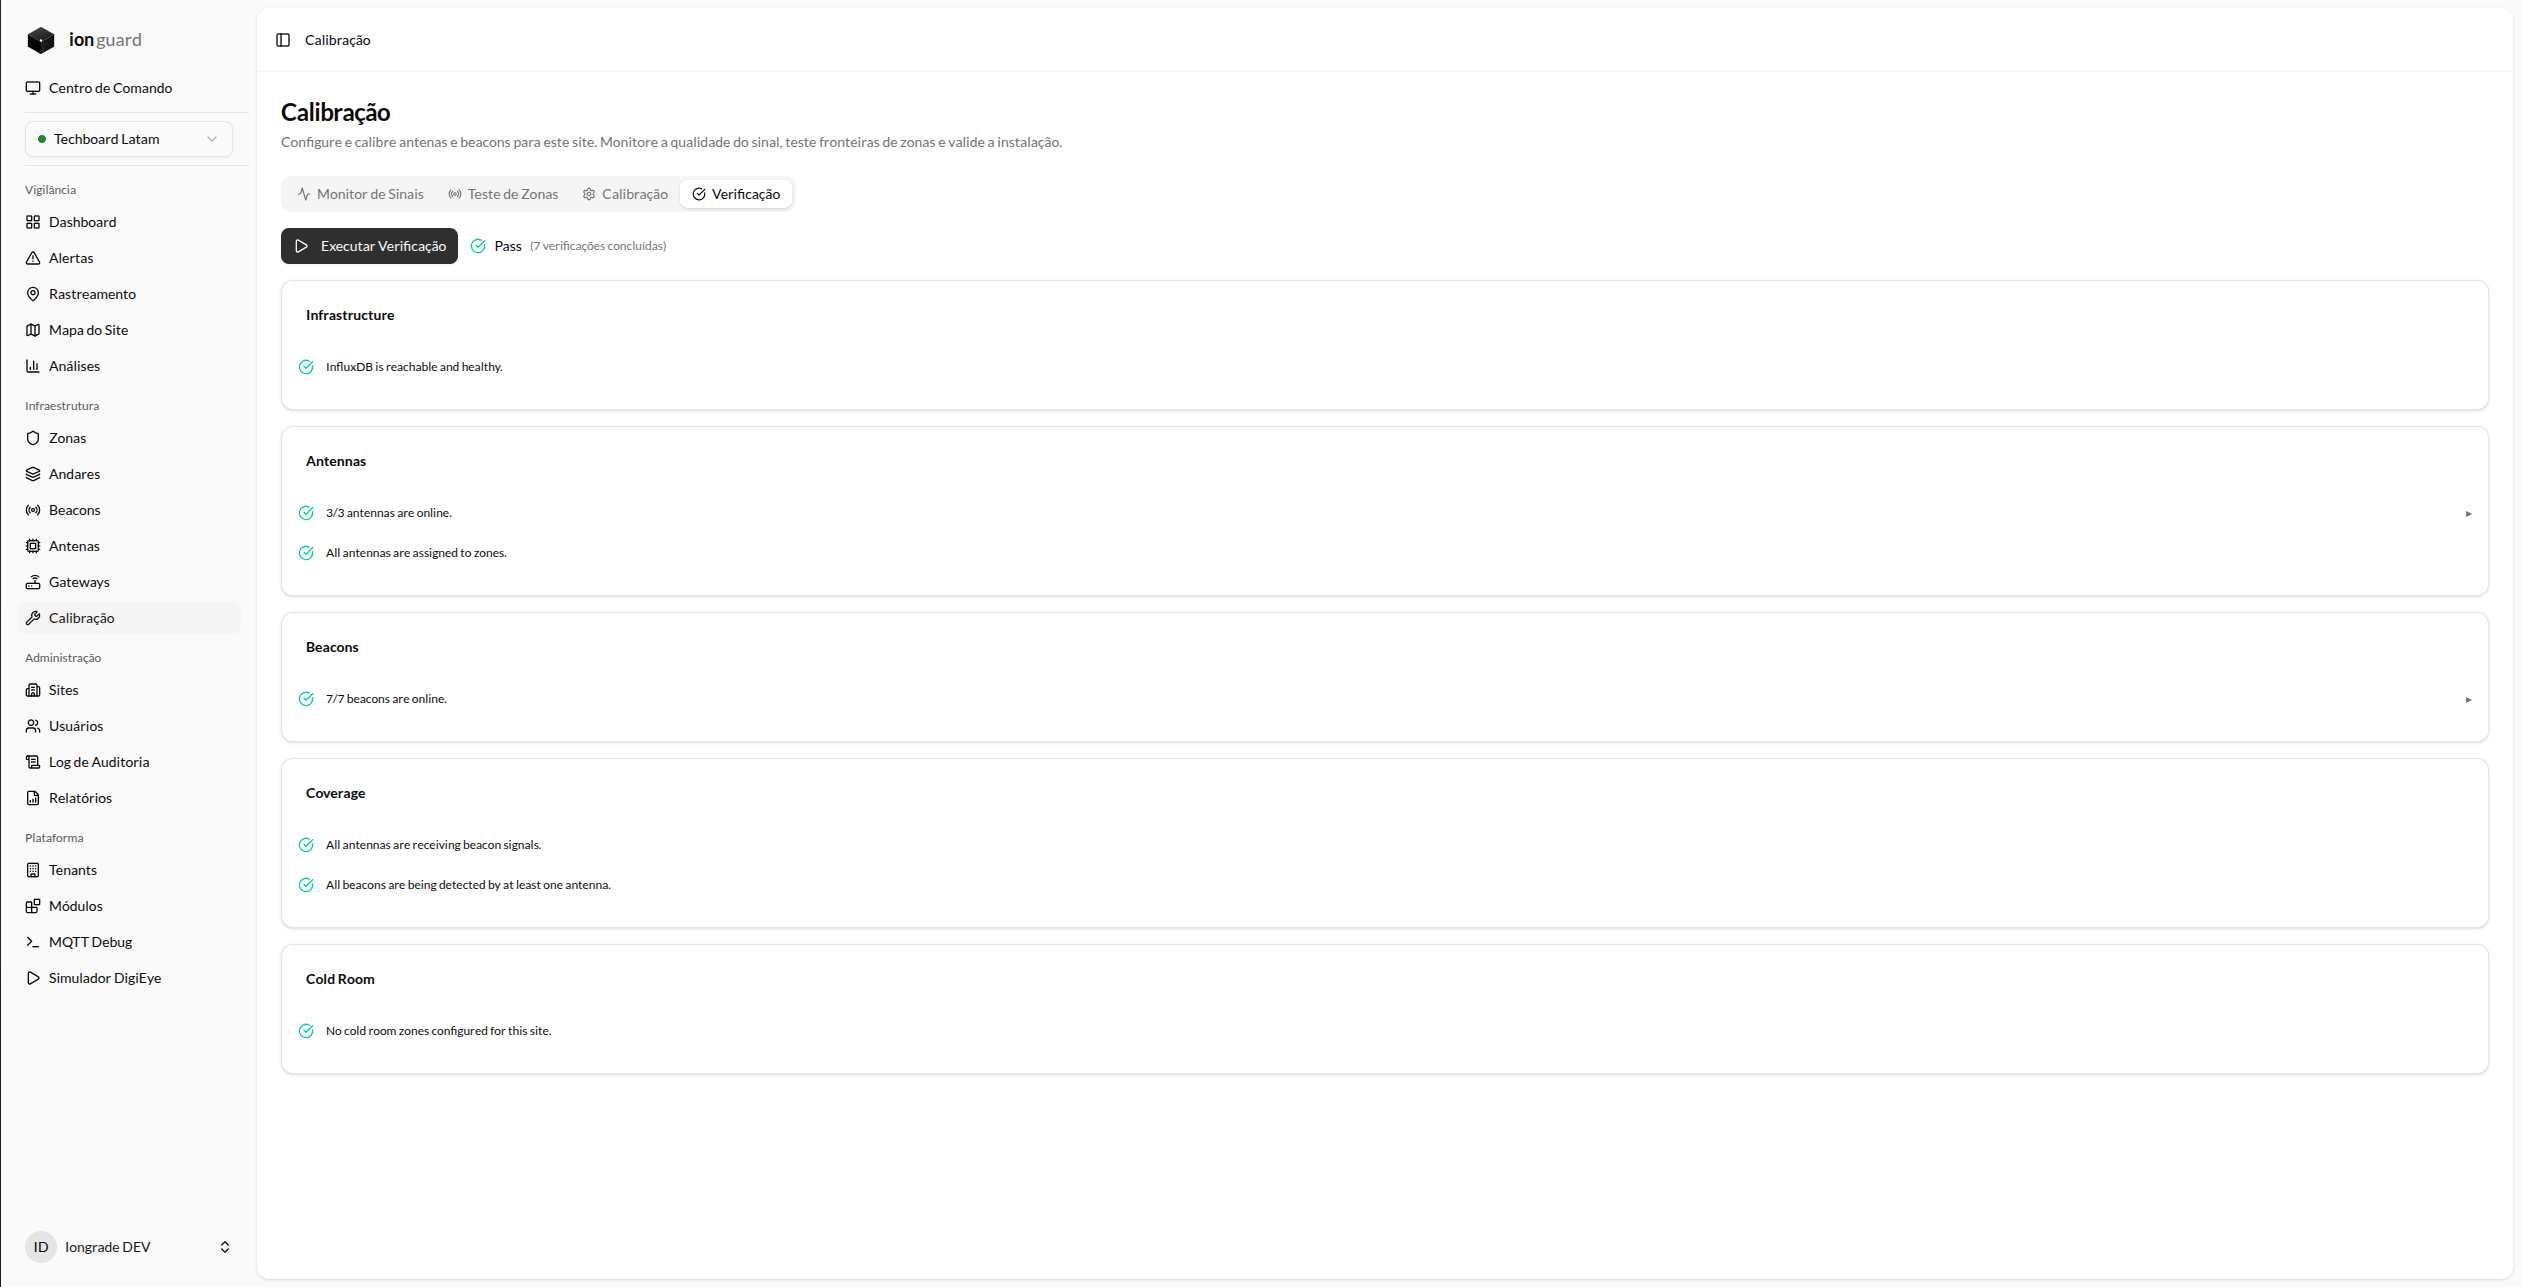
The Verification tab runs a complete diagnostic of the installation. Click "Run Verification" to start.
The result is presented in categories with visual indicators:
| Category | What it checks |
|---|---|
| Infrastructure | Connectivity with InfluxDB (time-series signal database) |
| Antennas | How many antennas are online and whether all are assigned to zones |
| Beacons | How many beacons are online and low battery alerts |
| Coverage | Whether all antennas are receiving signals and all beacons are being detected |
| Cold Room | Antenna coverage in cold room zones and recovery area configuration |
Each check displays a status icon:
| Icon | Meaning |
|---|---|
| ✅ Green | Check passed |
| ⚠️ Yellow | Attention — functional but with caveats |
| ❌ Red | Failure — requires action |
The overall result (Pass, Warning, or Fail) appears next to the button, with the total of completed checks.
The Cold Room category is only relevant when the Cold Room sub-resource of Synapsys is enabled on the site. See Cold Room Module for the full context.
- Before calibrating — make sure the infrastructure is healthy before adjusting parameters
- After installing or repositioning antennas — validate that they are online and assigned
- Periodically — as a health check-up of the installation
Recommended workflow
Initial installation
- Verification — Run the diagnostics and resolve any failures before proceeding
- Signal Monitor — Observe the heatmap and confirm that all antennas see the beacons
- Zone Test — Select each beacon and confirm that it is assigned to the correct zone with high confidence
- Boundary test — Walk with a beacon between zones and validate where the switch occurs
- Calibration — If necessary, adjust parameters or offsets based on the observations
- Final validation — Repeat the zone and boundary tests to confirm the adjustments
Later adjustment
If beacons are fluctuating between zones or the location is imprecise:
| Symptom | Suggested action |
|---|---|
| Beacon fluctuates between two zones | Increase the Hysteresis (e.g., 5 → 8 dBm) |
| Location is slow to update when the beacon moves | Decrease the Window Size (e.g., 15 → 10 s) |
| A specific antenna dominates even with the beacon far away | Apply a negative offset to the antenna |
| Antenna does not detect a nearby beacon | Check whether it is online; if so, apply a positive offset |
| Consistently low confidence | Check Min Signals and the physical positioning of the antennas |
| Many signals being discarded (see Signal Summary) | Decrease the RSSI Threshold (e.g., -90 → -95 dBm) |
Best practices
- Adjust one parameter at a time and validate the result in the Zone Test before changing another
- Start with the defaults — they work well for most environments
- Use an offset before changing global parameters — a problem localized to one antenna does not justify changing the behavior of the entire site
- Document the adjustments — record why each offset was applied to facilitate future maintenance
- Repeat the Verification after any change to the physical infrastructure (repositioning an antenna, adding a zone)
Next steps
- Tracking — How the location calculation works
- Zone Map — Interactive visualization with floor plans
- Synapsys Module — Overview of the tracking module