Analytics and Reports
The cold room module offers analytical dashboards for tracking trends and report generation tools for compliance and auditing.
Analytics Page
The analytics page presents three tabs with complementary views: Overview, Zones, and Workers. All tabs have a period selector for historical analysis.
Overview tab
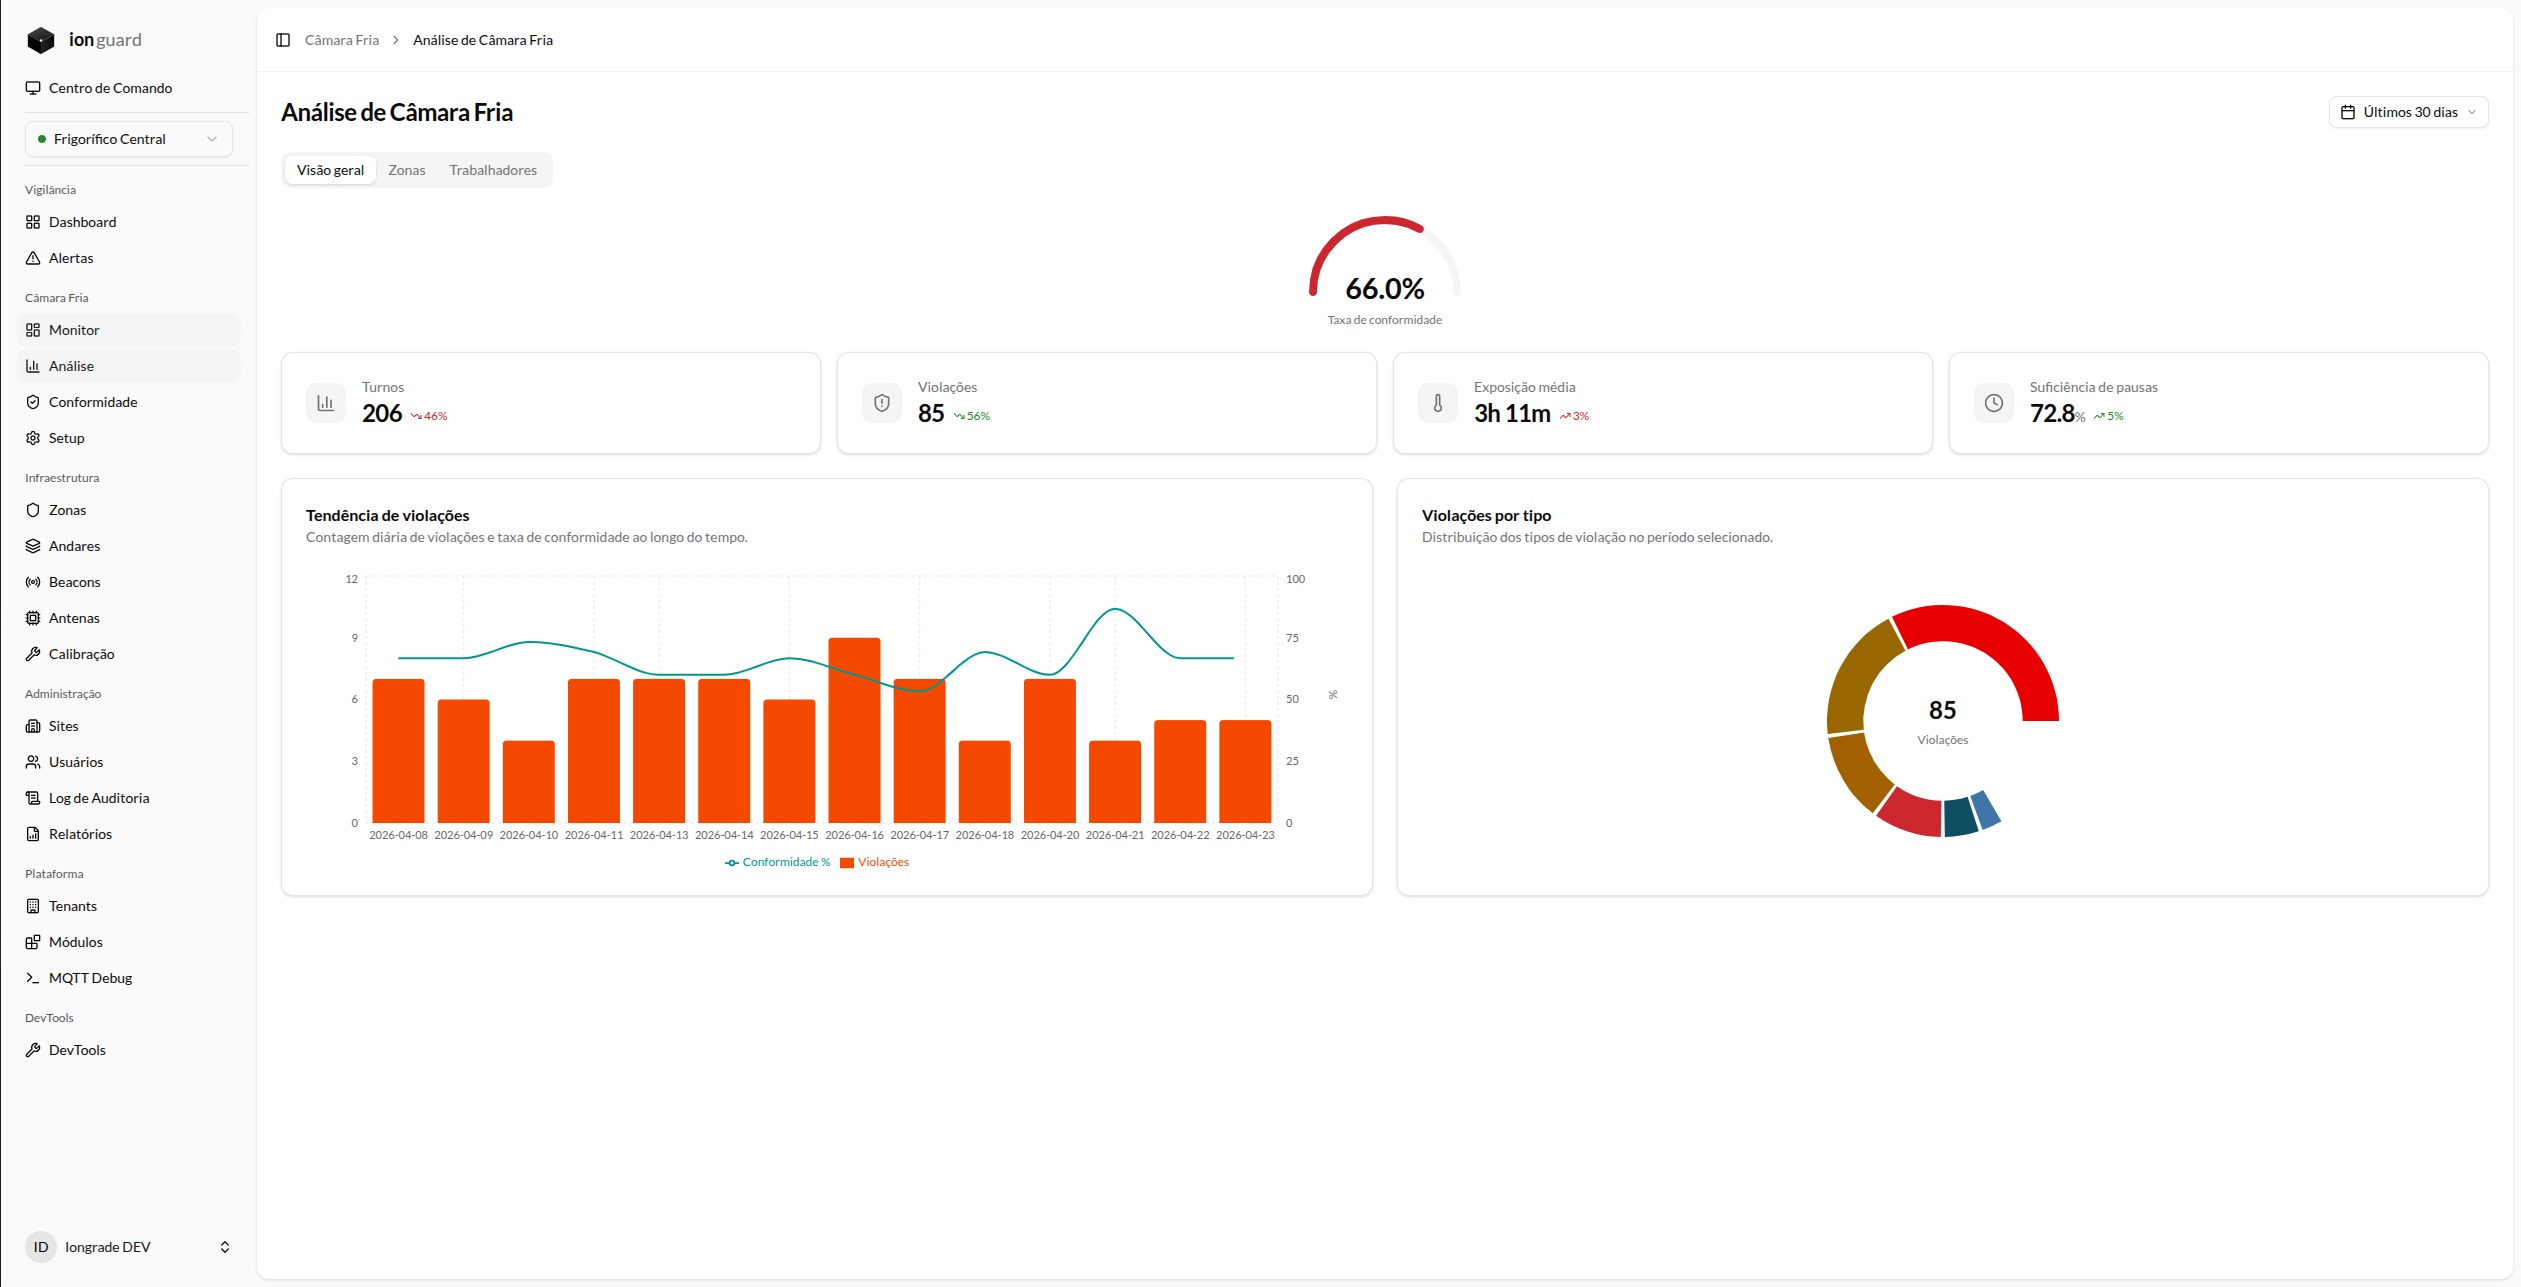
| Component | Description |
|---|---|
| Compliance rate | Percentage gauge showing the proportion of compliant shifts in the period |
| Key indicators | Cards with: total shifts, violations, average exposure per zone, break sufficiency |
| Violation trend | Bar chart showing violations vs. compliance over time |
| Violations by type | Donut chart with the distribution of the 6 violation types |
Zones tab
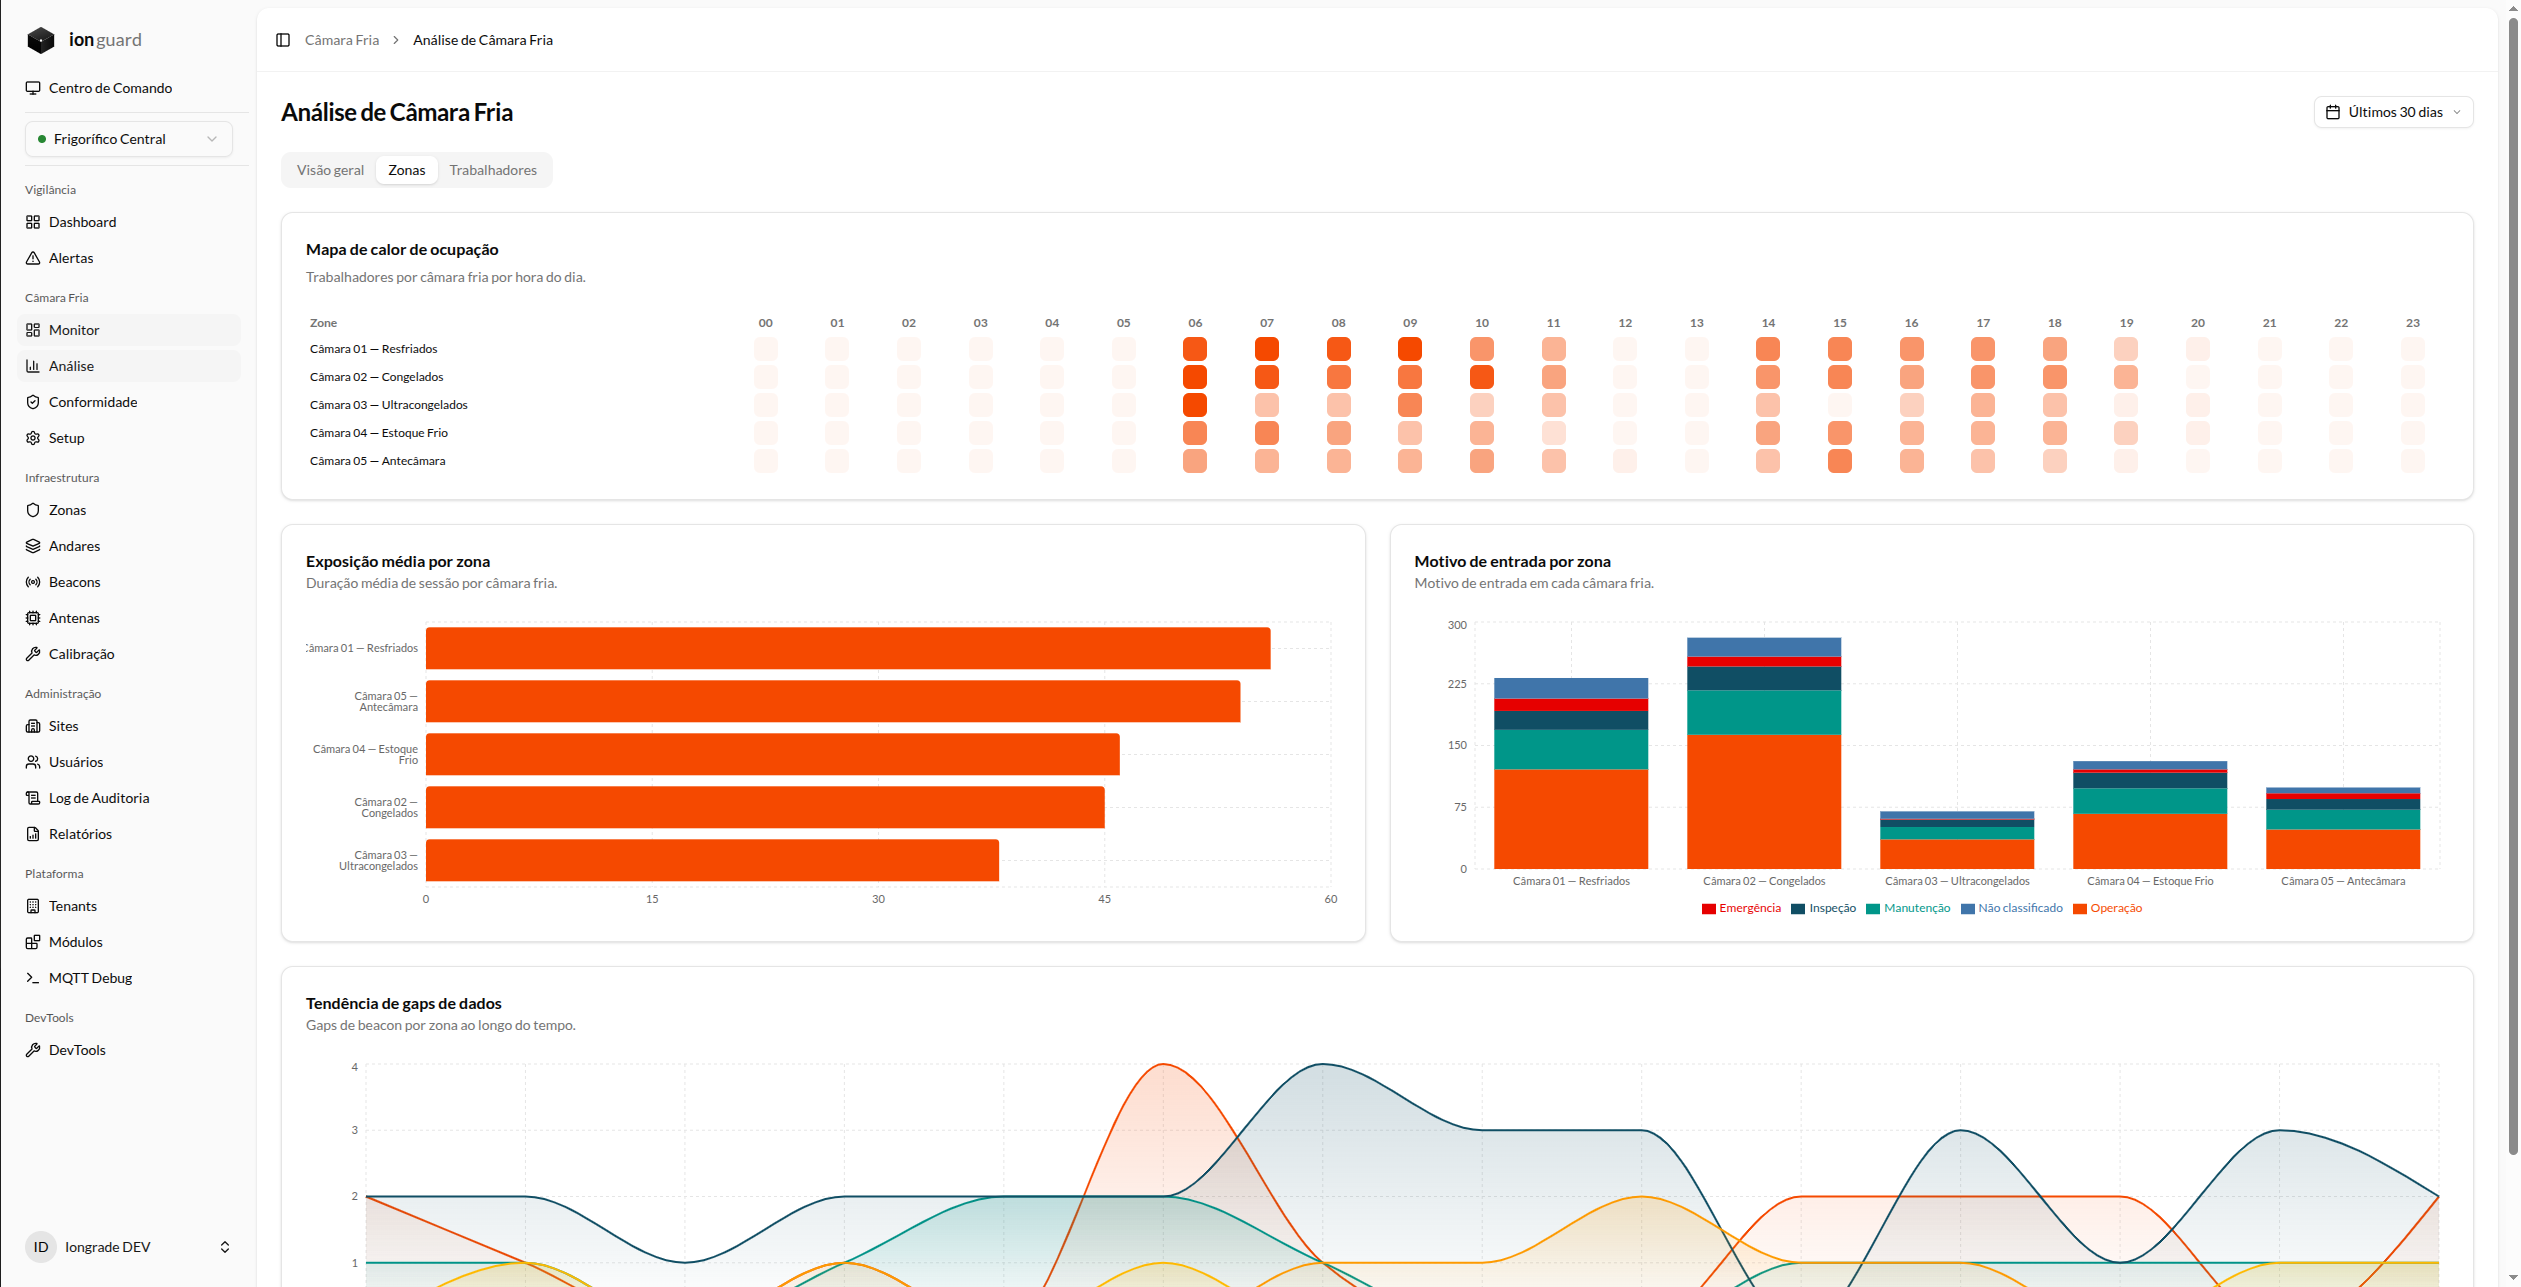
| Component | Description |
|---|---|
| Occupancy heat map | Visualization by hour of day showing which times have the highest occupancy in each cold room |
| Average exposure per zone | Horizontal bars comparing the average exposure time per cold room |
| Entry reasons per zone | Stacked bars showing the distribution of reasons (operation, maintenance, inspection, emergency) |
| Gap trend | Trend line showing data gaps (lost signals) over time |
Workers tab
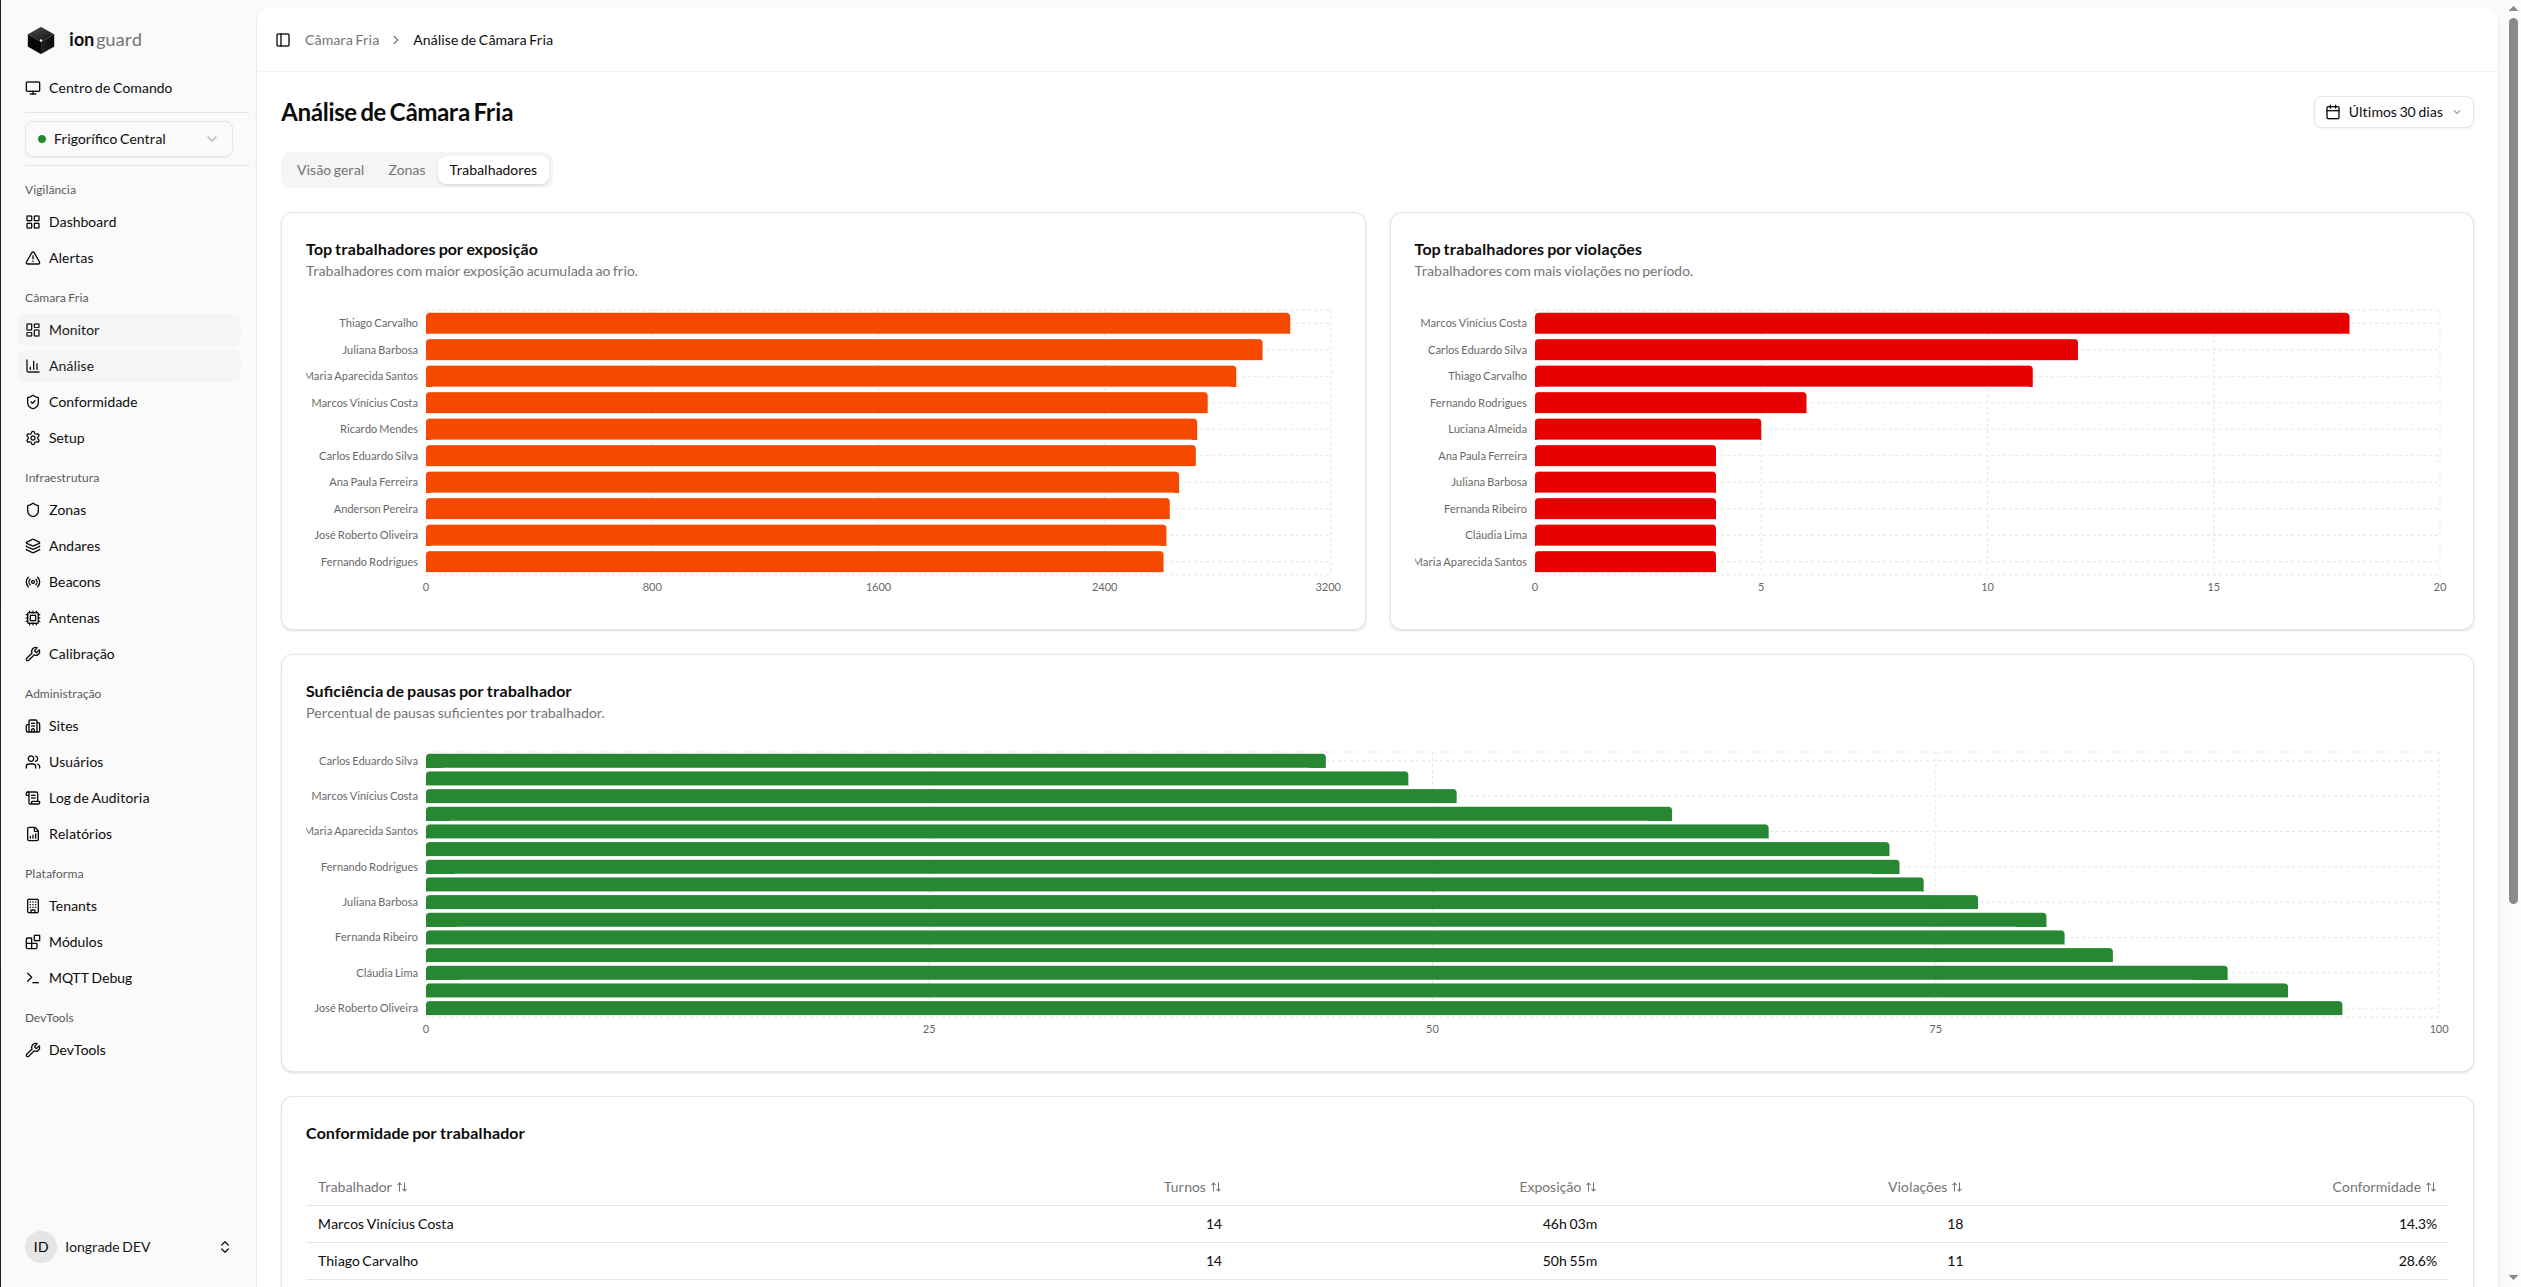
| Component | Description |
|---|---|
| Top by exposure | Ranking of workers with the highest total exposure time |
| Top by violations | Ranking of workers with the most violations |
| Break sufficiency | Bars showing the sufficient-break rate per worker |
| Compliance table | Individual table with consolidated metrics per worker |
Report Generation
Available report types
| Type | Description | Format |
|---|---|---|
| NR-36 Compliance | Complete compliance report with exposure, break, violation, and status data per worker | CSV, PDF |
| Alert Response SLA | Report on cold room alert response times | CSV |
How to generate a report
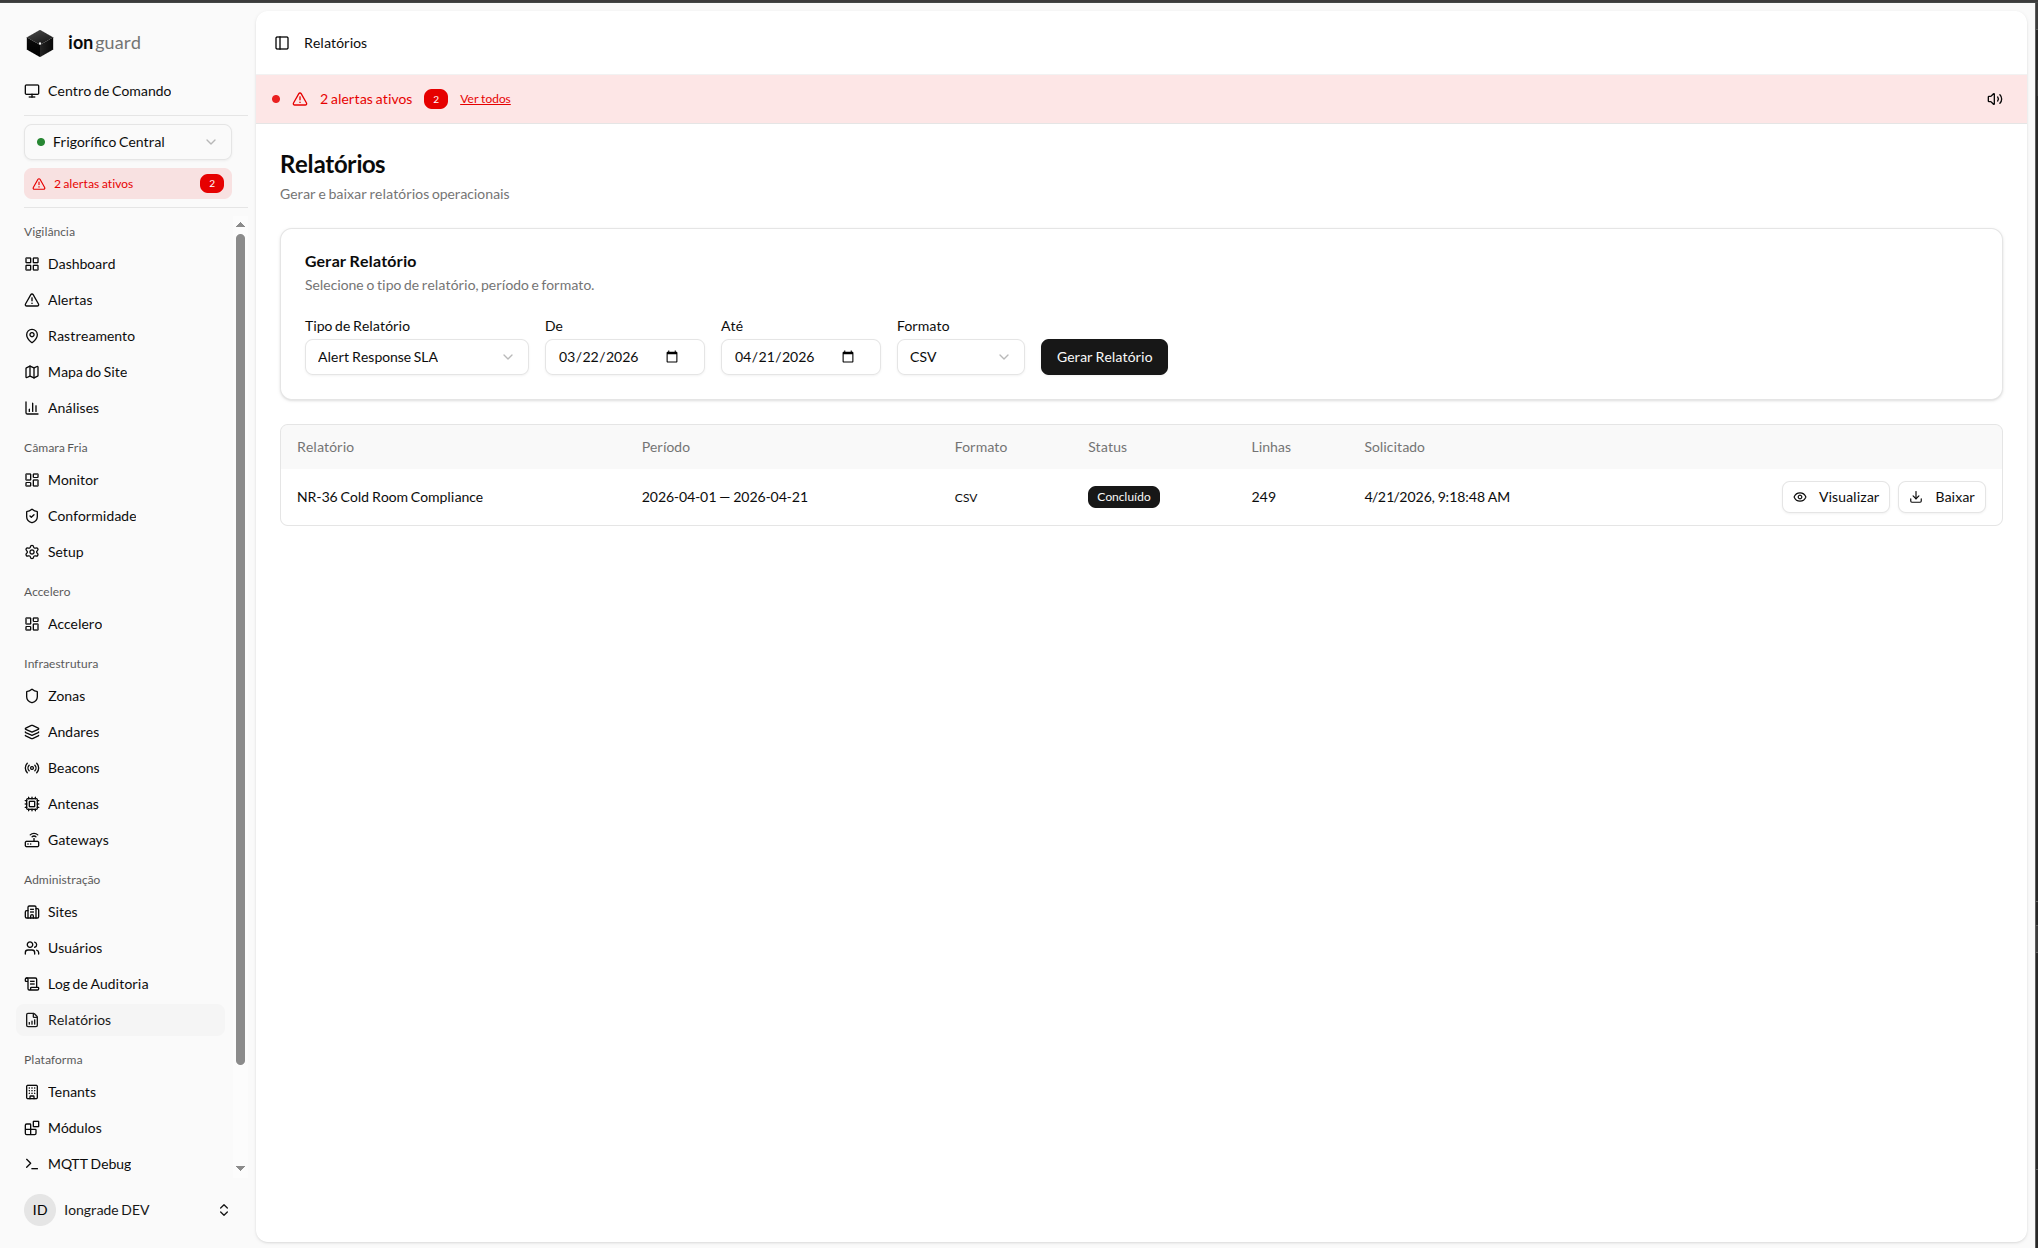
- Go to Cold Room > Reports
- Select the report type
- Set the period (start and end date)
- Choose the format (CSV or PDF)
- Click Generate
The report is processed in the background. When ready, it appears in the history table with these options:
- View — open the report in the browser
- Download — download the file
Report integrity
SHA-256 hash
Each generated report receives a SHA-256 hash of its content. This hash works as a "fingerprint": any change to the report, however small, produces a completely different hash.
Report chaining
Each new report stores the hash of the previous report, forming an integrity chain:
Report 1 → hash₁
Report 2 → hash₂ + reference to hash₁
Report 3 → hash₃ + reference to hash₂
If any intermediate report is altered, the chain breaks and verification fails.
Integrity verification
The system offers a verification feature: the administrator can request the recomputation of any report's hash and compare it with the stored hash. If the values differ, the report was tampered with.
The hash and chaining mechanism gives the reports evidentiary value in the event of a labor audit. The data is auditable and cannot be modified retroactively without the tampering being detected.
Multi-site view
For organizations with multiple units, the platform offers a consolidated geographic view:
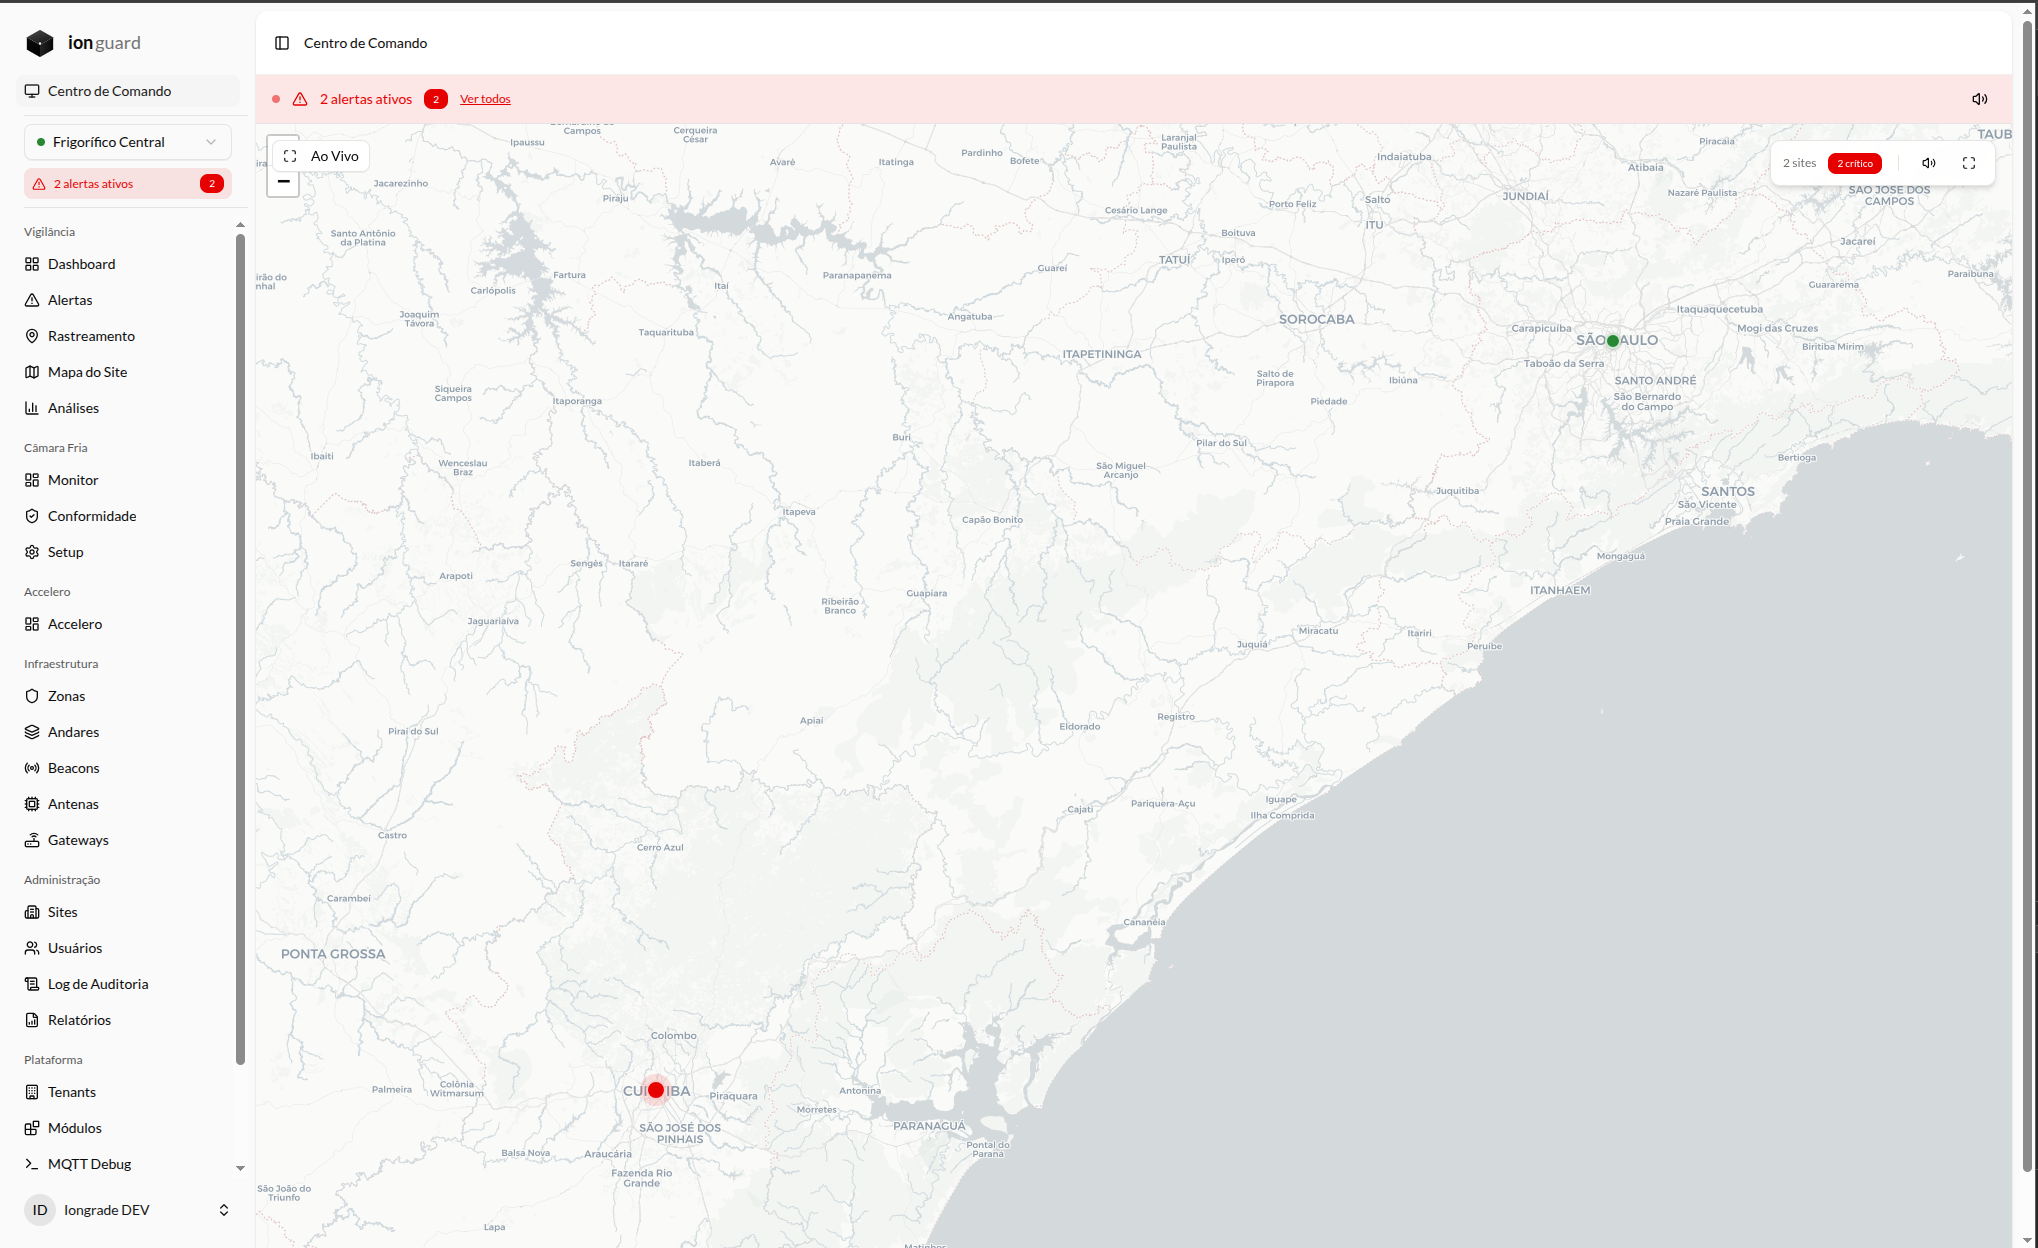
The map shows:
- Location of each site on the map
- Status indicators (badges with the count of active alerts)
- Quick access — click a site to navigate to its monitoring panel
This view is useful for regional or corporate managers who oversee multiple cold room operations.