Getting Started
This guide walks you through your first access to the ION Guard platform, from login to navigating the main features.
Login
Open the platform URL in your browser (e.g., https://ionguard.cliente.local).
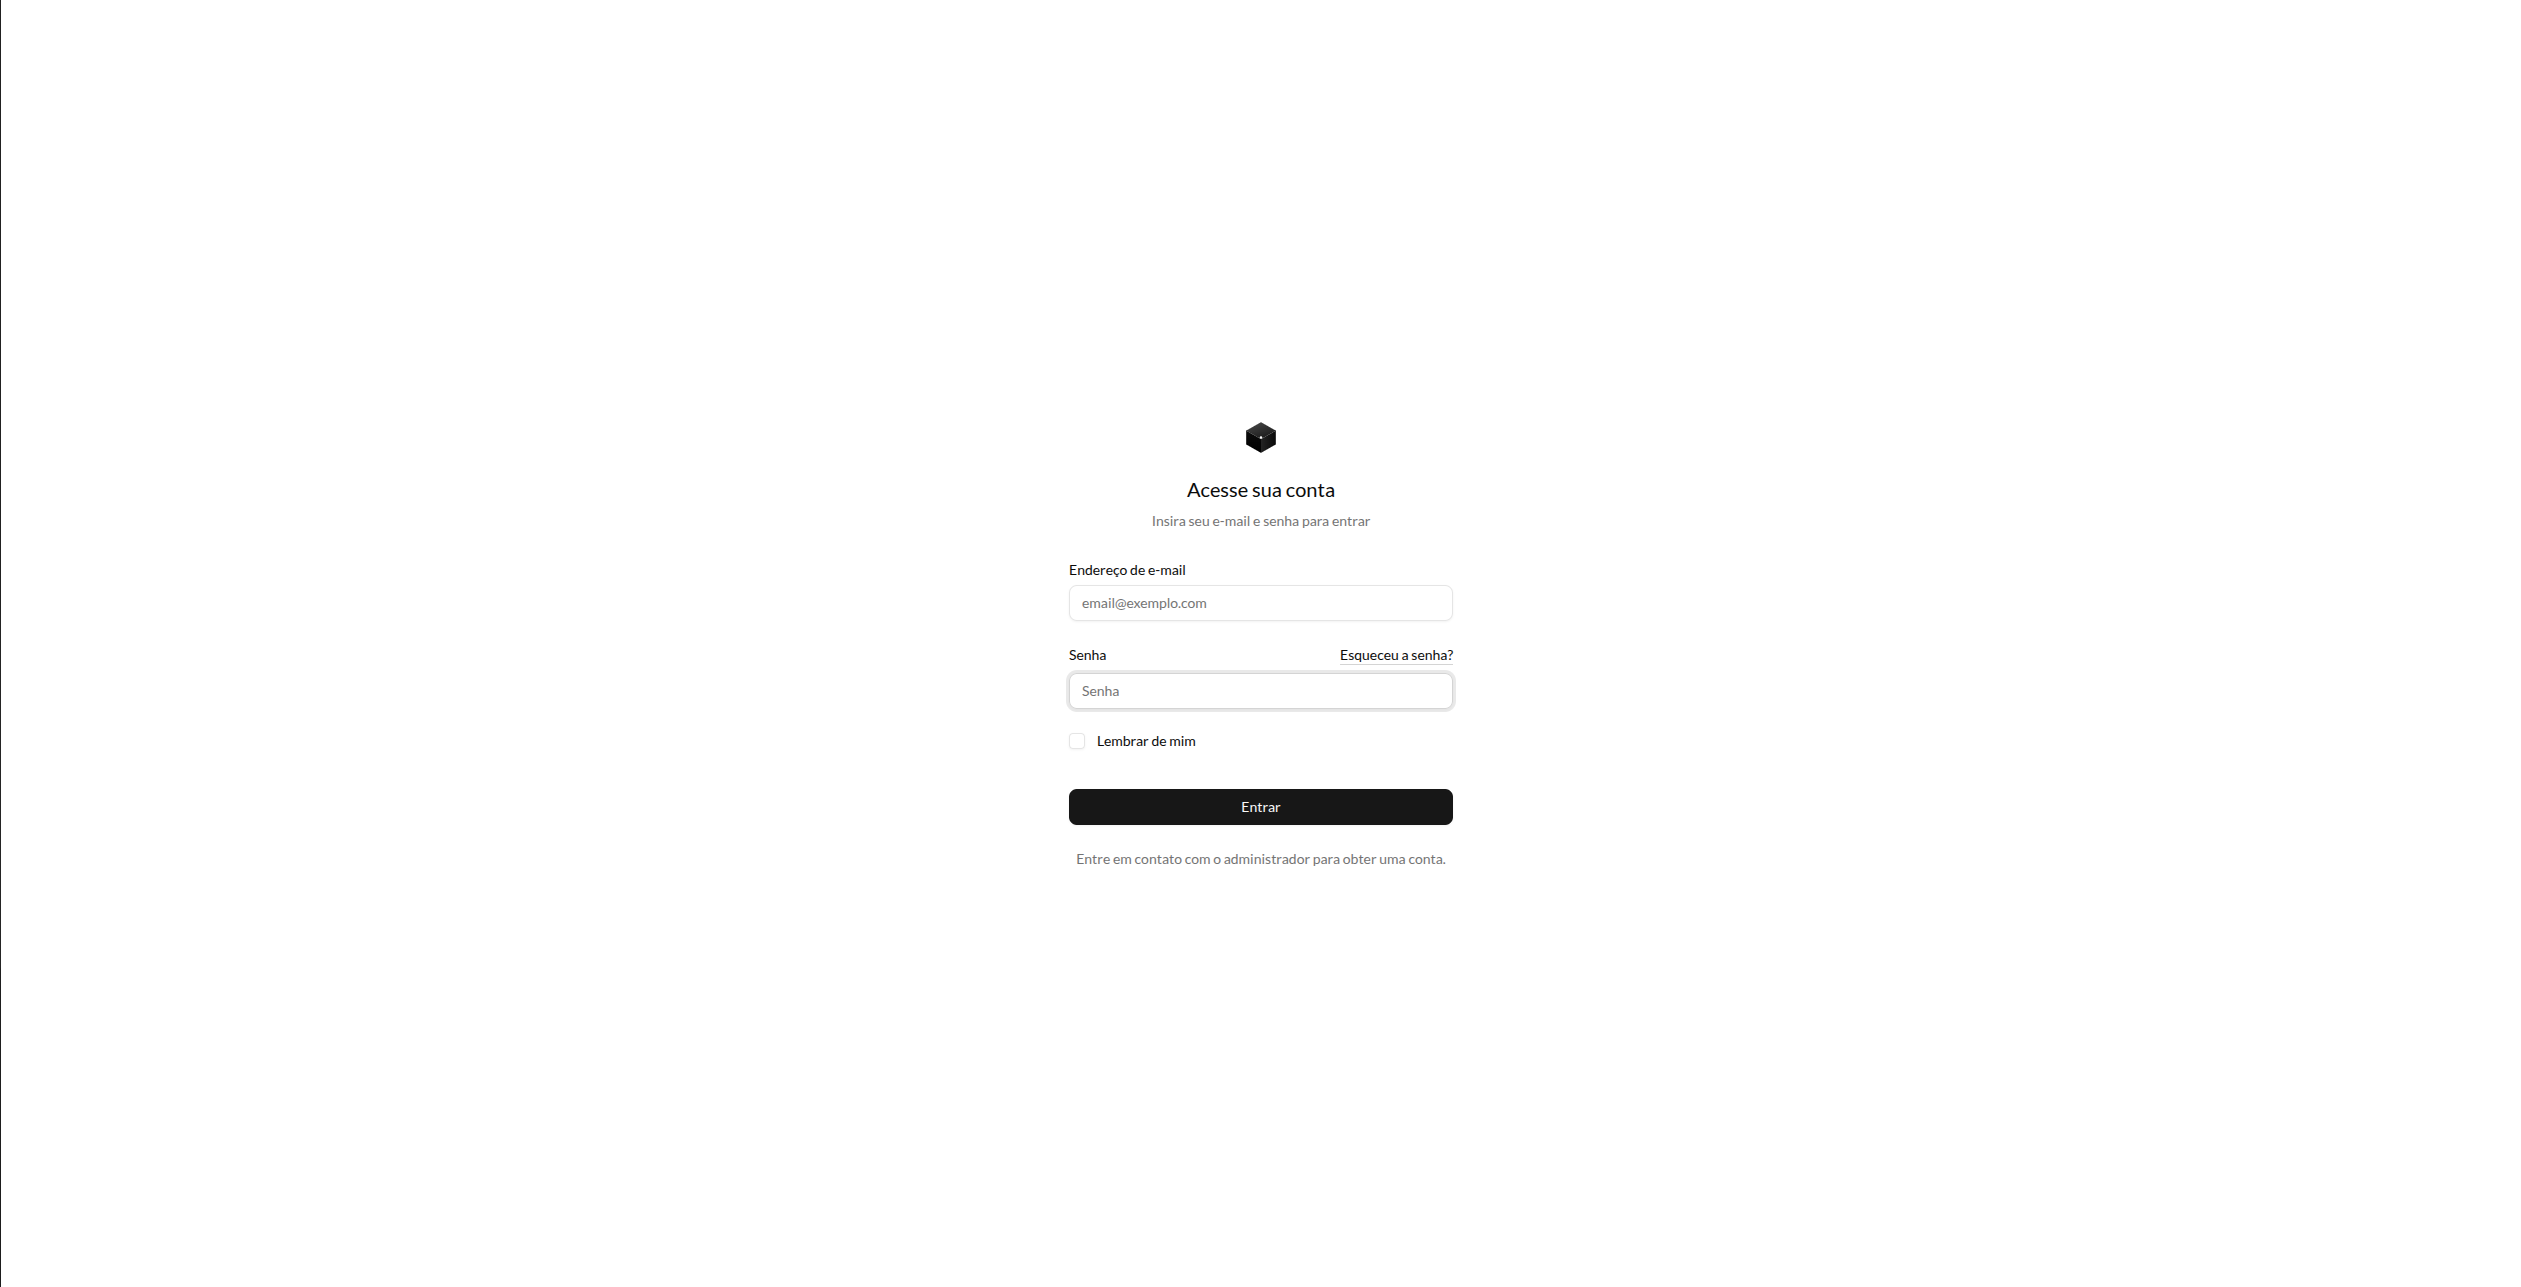
On the login screen, enter:
- Email — your registered email address
- Password — your access password
- Remember me — check to keep your session active longer
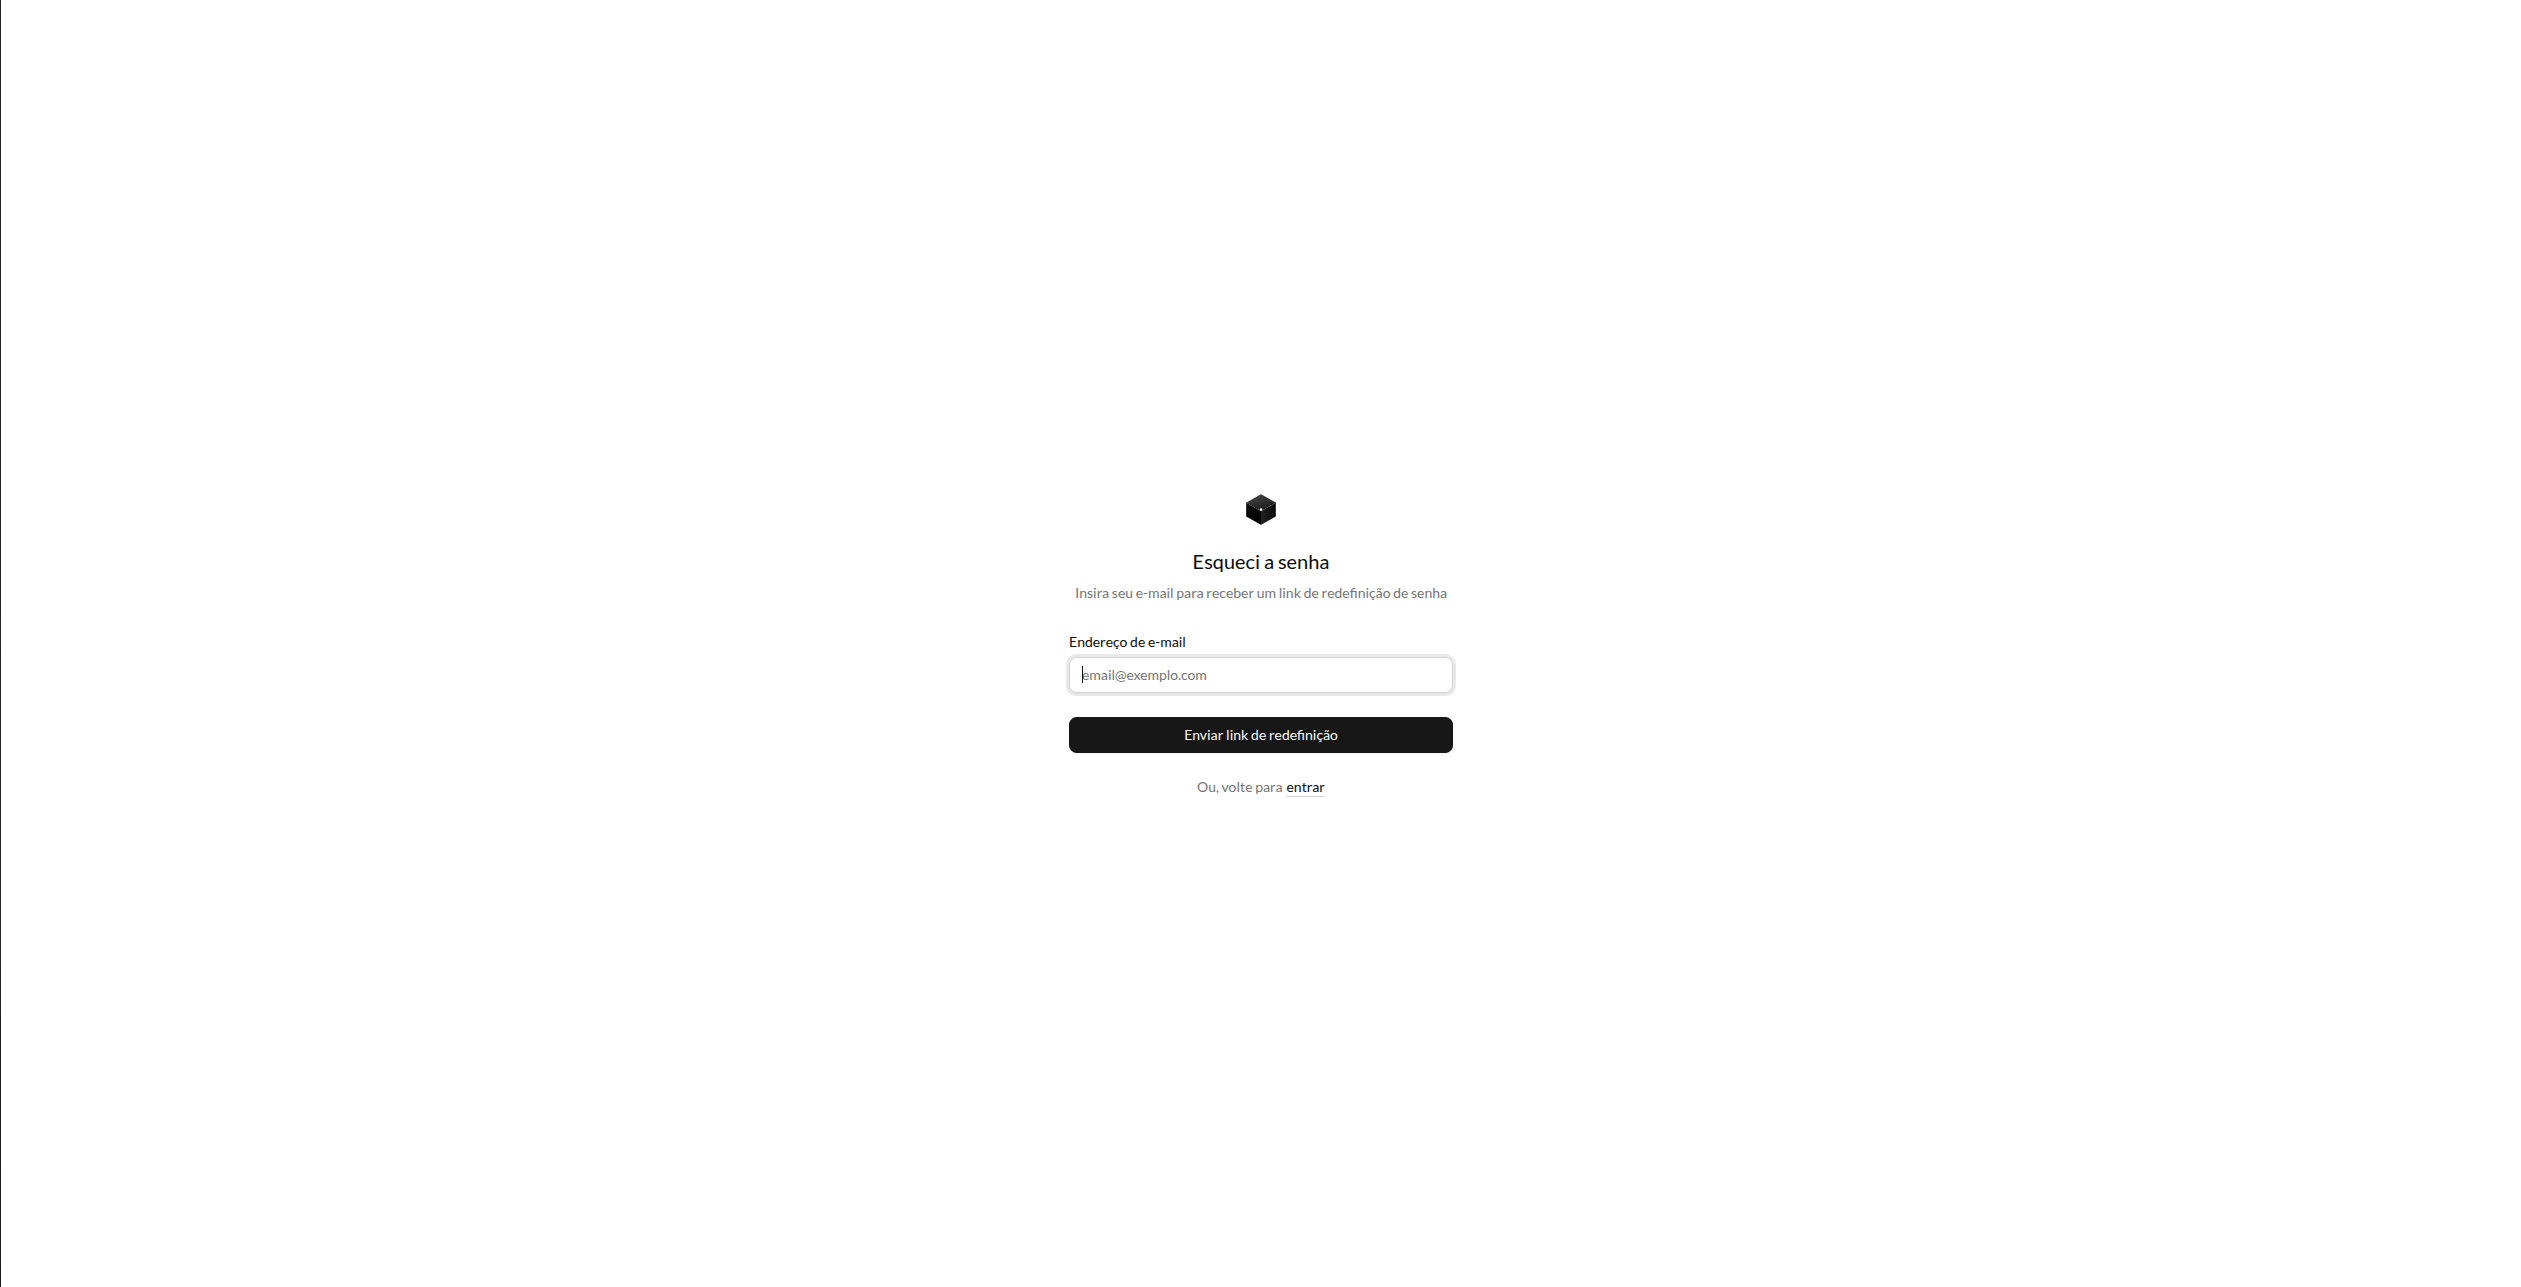
Click "Forgot my password" on the login screen. A reset link will be sent to your registered email address.
Main screen
After logging in, you are taken to the Dashboard — the summary of the selected site, with the active alerts card and the most recent alerts.
For map monitoring, use the Command Center, available from the item at the top of the sidebar.
Command Center — what you see
- Interactive map — Displays all organization sites with their geographic locations
- Alert indicators — Sites with active alerts are highlighted on the map with visual indicators and a pulsing animation
- Alert summary — In the upper-right corner, the total number of active alerts with sound and full-screen controls
- "Live" button — Opens the dedicated full-screen monitoring view
Interacting with the map
- Click a site to see the active alerts for that location
- Acknowledge or resolve alerts directly in the side panel that opens
- Panic alerts trigger an audible alert automatically (use the mute button to silence it)
Navigation
The left sidebar contains the main menus:
Site selector
At the top of the sidebar, the site selector lets you switch between the sites you have access to. Many pages are filtered by the selected site.
Main menu
Menu items vary according to your access profile. The most common sections are:
| Menu | Description |
|---|---|
| Dashboard | Home screen after login: site summary and recent alerts |
| Command Center | Site map with real-time alerts |
| Alerts | Full alert list with filters and actions |
| Sites | Location management (Admin) |
| Zones | Zone management within the site |
| Users | User management (Admin) |
| Audit | Log of all system changes |
| Reports | Report generation and download |
Enabled modules automatically add items to the menu. For example, the Synapsys module adds Beacons, Antennas, and Tracking sections.
Alert badge
In the sidebar, a colored badge shows the number of active alerts:
- Red — critical or high-severity alerts
- Amber — warning alerts
Real-time updates
The platform operates in real time via WebSocket. You do not need to refresh the page to see new data:
- New alerts appear instantly with an audible notification
- Actions by other operators (acknowledgment, resolution) are reflected automatically
- Counters and indicators update in real time
Next steps
- Dashboard — Understanding indicators and metrics
- Alerts — How to respond to panic and emergency alerts
- Command Center — Detailed real-time monitoring