Dashboard
Overview
The Dashboard (Control panel) consolidates the visit operation indicators into cards and charts, with a period selector (e.g., "Last 7 days"). There are two views: the general panel (all companies), opened from the Control panel menu, and Analytics per company, opened from the Analytics action of a specific company — the same indicator structure, scoped to a single tenant.
How to access
- General panel: side menu Control panel.
- Company Analytics: in the Companies list, company actions menu > Analytics (the header shows the company name).
Indicators (cards)
The general panel shows summary cards, each with the percentage comparison against the previous period:
- Visits in progress
- Rejected visits
- Awaiting arrival
- Completed visits
- Visits today
- Unique visitors
- Average approval time (e.g., "40 min")
- Rejection rate (percentage)
Charts and tables (general panel)
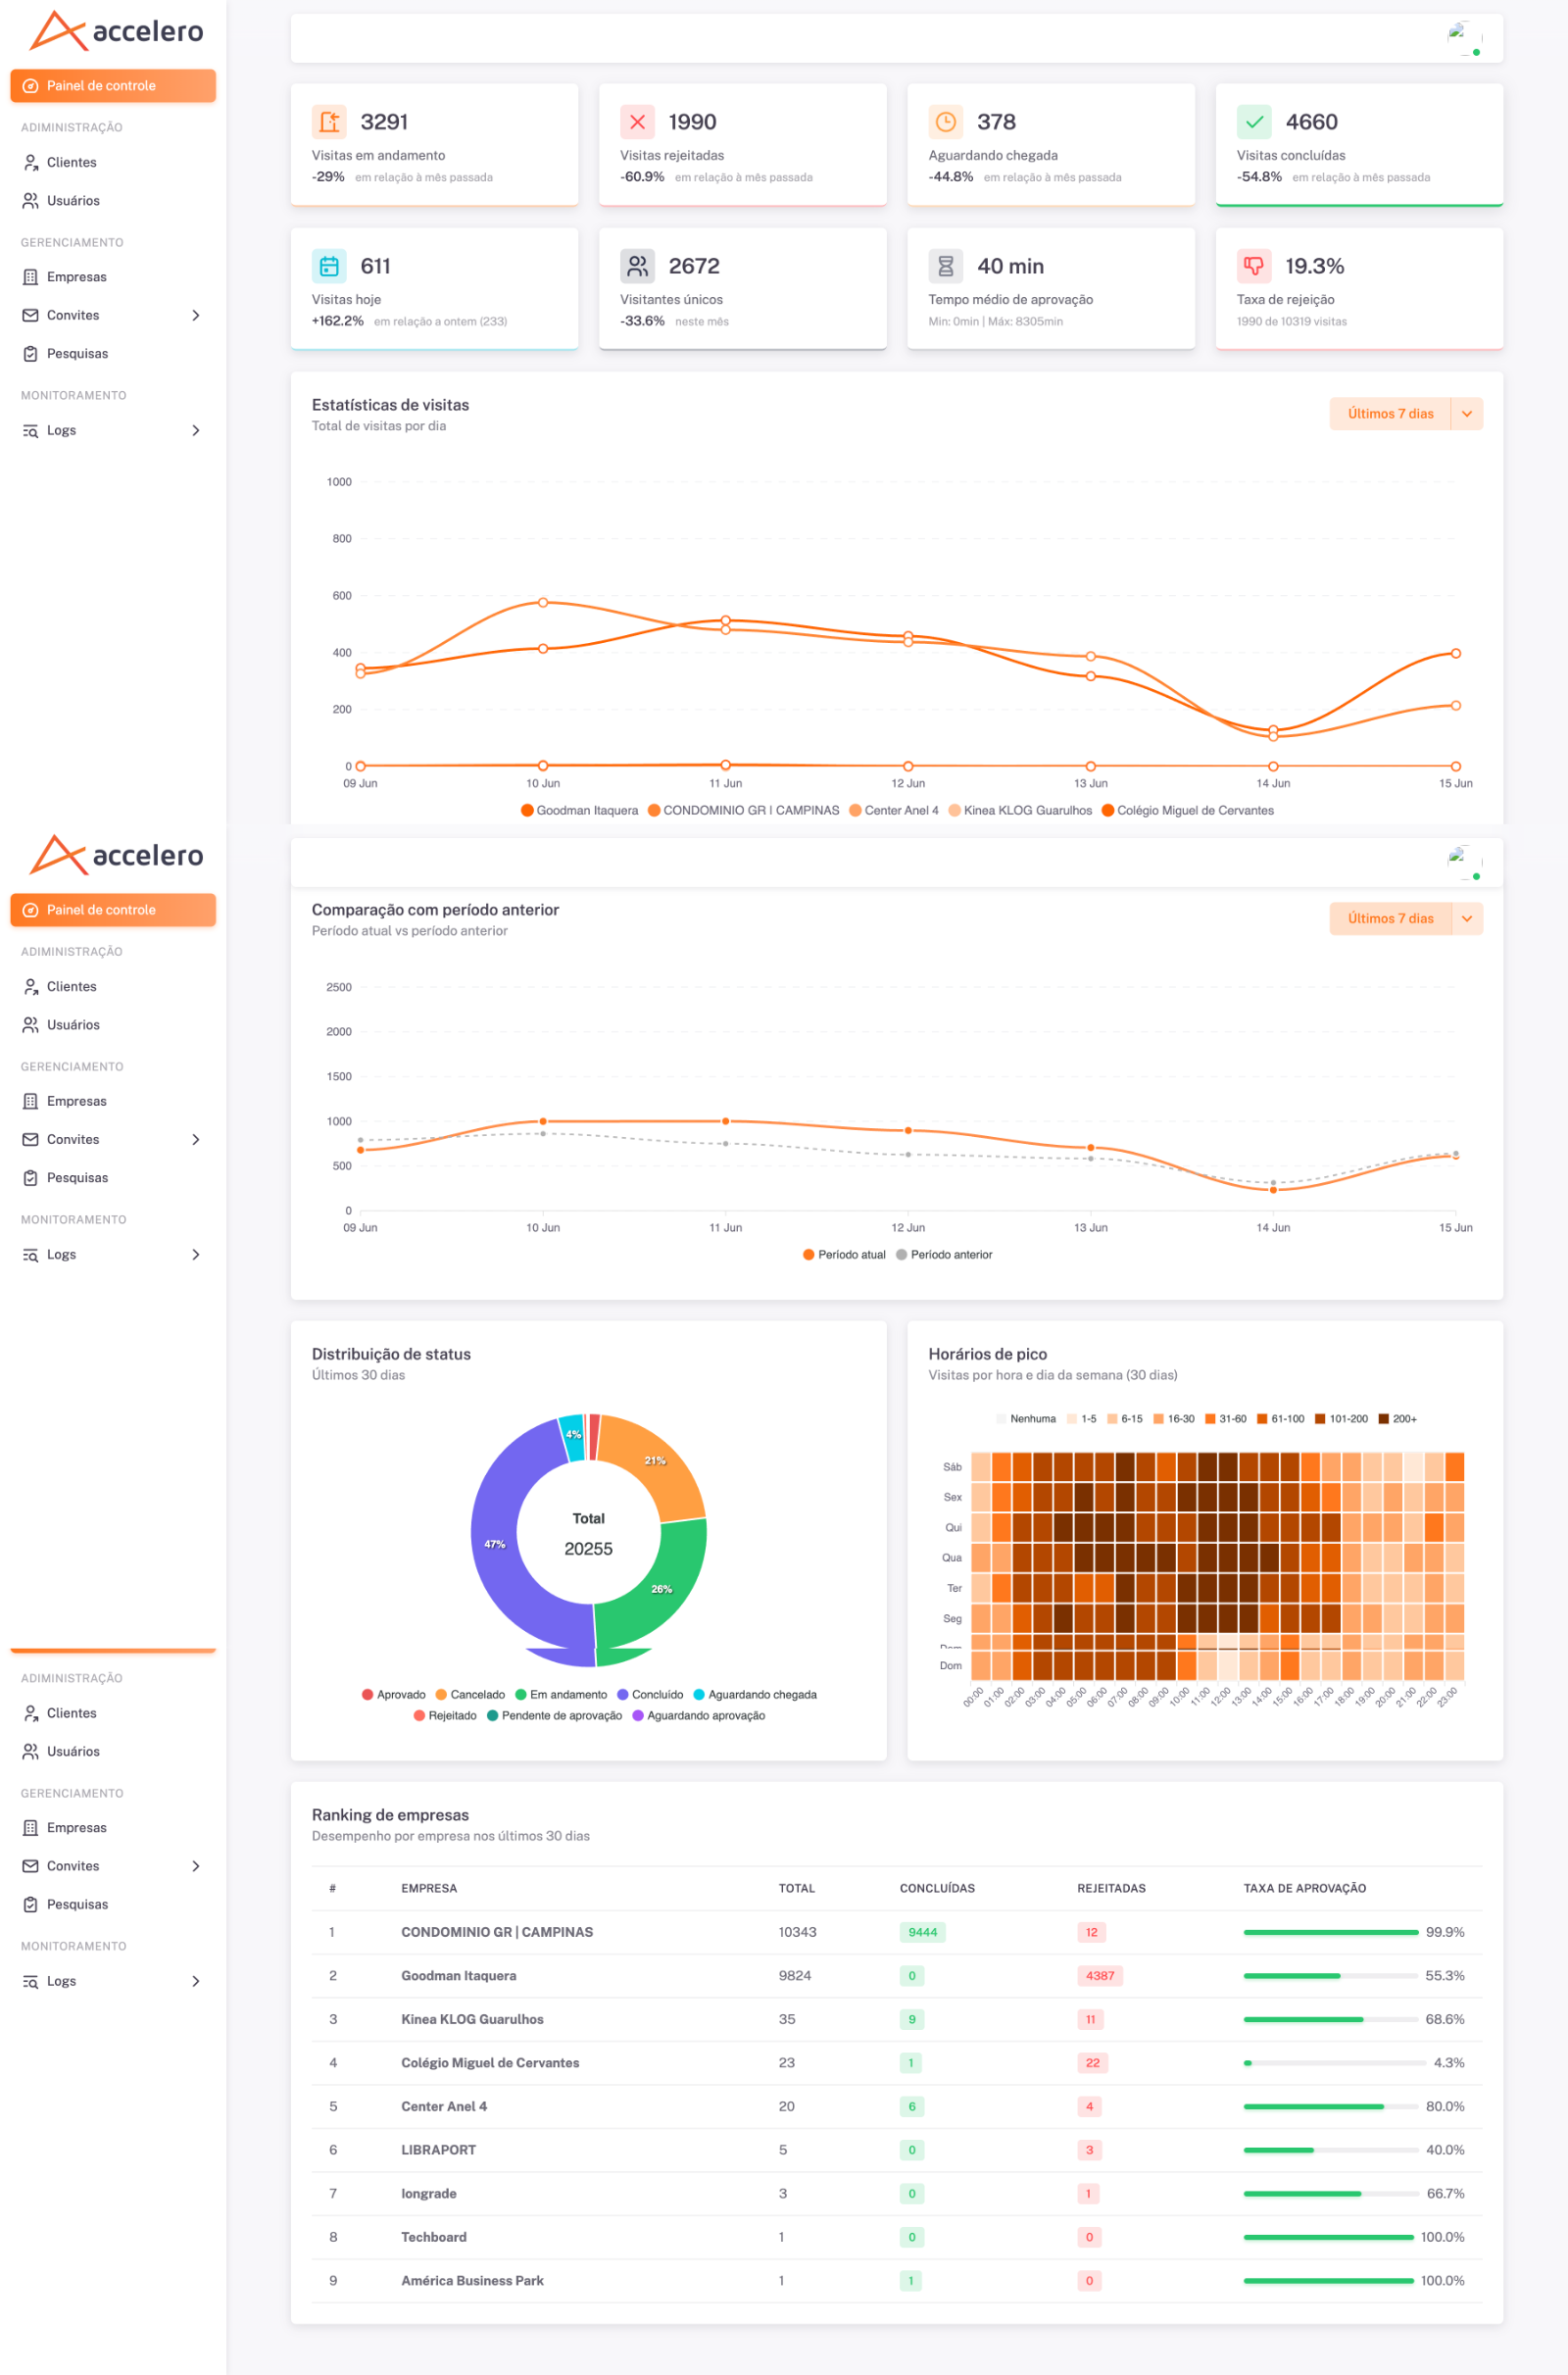
- Visit statistics — time series of visits in the period (with period selector).
- Comparison with the previous period — line for the Current period vs. Previous period.
- Status distribution — donut chart with the total and the share of each status: Approved, Canceled, In progress, Completed, Awaiting arrival, Rejected, Pending approval, Awaiting approval (last 30 days).
- Peak hours — heat map of visits by hour and day of the week (ranges: None, 1-5, 6-15, 16-30, 31-60, 61-100, 101-200, 200+), over the last 30 days.
- Company ranking — performance by company over the last 30 days, with the columns #, Company, Total, Completed, Rejected, Approval rate.
Charts and tables (Analytics per company)
The per-company view repeats the cards and also brings tenant-level breakdowns:
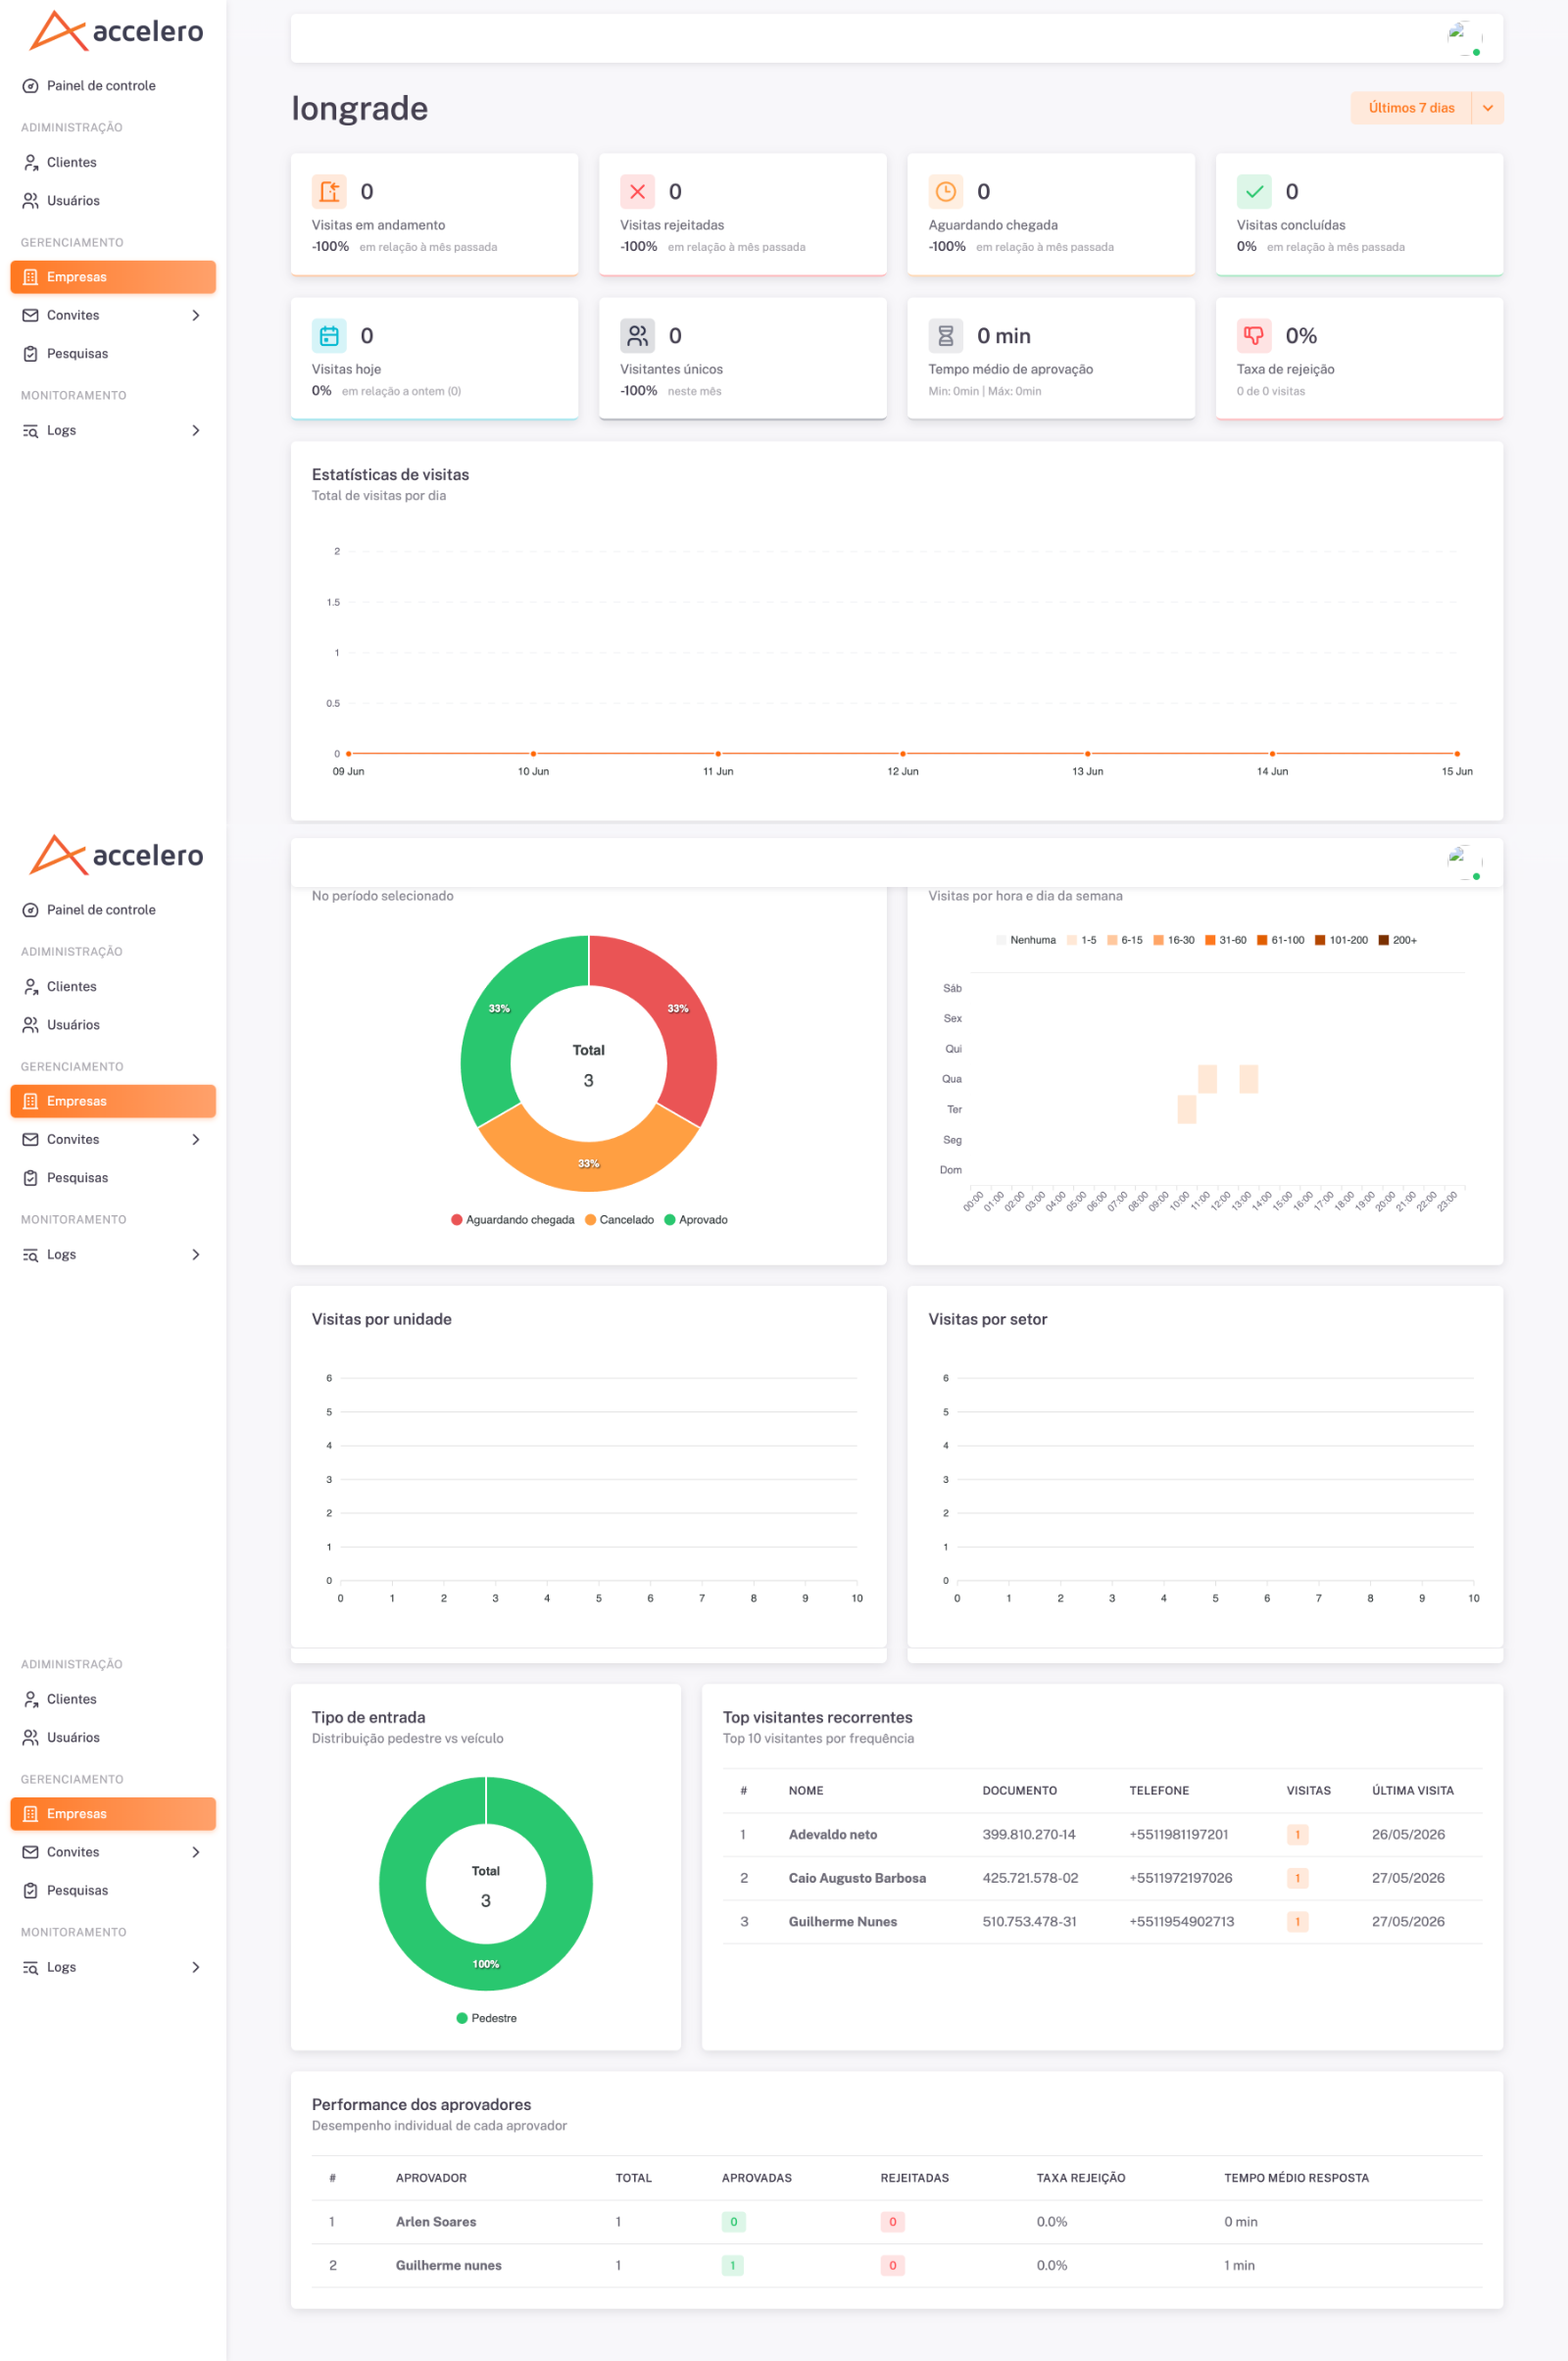
- In the selected period — status donut chart (Awaiting arrival, Completed, Approved).
- Visits by hour and day of the week — heat map.
- Visits by unit and Visits by department — internal distribution.
- Entry type — donut chart by visitor entry type.
- Top recurring visitors — table with Document, Phone, Visits, Last visit.
- Approver performance — table with Approver, Total, Approved, Rejected, Rejection rate, Average response time.
Filters
- Period selector (e.g., "Last 7 days") applied to the charts/cards.
- In Analytics, the scope is already the selected company.
The unit/department breakdowns and the ranking/listings by company reflect the structure synchronized with Accelero; zeroed numbers or missing units in a tenant usually point to synchronization (Units) or to the company's integration data (Companies).
Related
- Companies
- Invitations
- Logs and analytics
- Approvers